Fidelity India Focus, Morant Wright Japan and Jupiter Merian Asia Pacific have outperformed year in, year out.
The ability to consistently beat a benchmark is what makes a great active manager.
In the Investment Association Asia sectors, no funds managed to outperform the most common benchmark in their peer groups every single year for the past decade, although some funds achieved that feat in eight of the past 10 years. For Japan, seven years of outperformance was the high water mark.
To help investors select the funds that justify their fees, Trustnet highlights below which IA China, IA India, IA Japan and IA Asia Pacific Excluding Japan strategies can claim the title of the most consistent funds of the decade.
We used FE Analytics data and only considered funds with 10-year track records.
We begin with the IA China sector, where only two funds managed to consistently beat the most common benchmark of the peer group, the MSCI China All Shares index, since 2014 – FSSA Greater China Growth and Schroder ISF Greater China. Both have outperformed in eight years out of the past 10.
The former is a £428.5m benchmark-agnostic, multi-cap strategy co-managed by FE fundinfo Alpha Manager Martin Lau and Helen Chen, who has been working on the fund since 2019.
Square Mile analysts said that Lau and Chen focus on quality businesses, selected with a “rigorous bottom-up research process, where company and country visits help build their collective knowledge and assessment of a business's growth sustainability, franchise, financial strength and management.
“Overall, we see this fund as a very strong and wholly viable option for long-term investors who wish to access the greater China region in a more conservative manner, where the emphasis is on identifying high quality growth companies,” the analysts said.
In the past decade it underperformed the reference index in 2020 and 2014 only, as the table below shows.
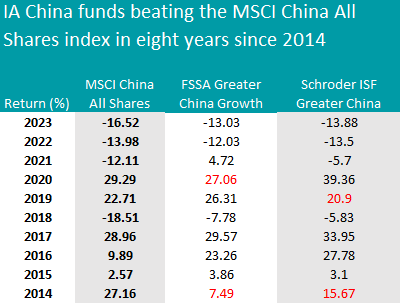
Source: Trustnet, MSCI (for the 2014 index performance). The red highlights represent underperformance against the reference index.
The $2.2bn Schroder ISF Greater China portfolio managed by Louisa Lo achieved a similar performance – the two funds are in fact 95% correlated to each other and have a similar split between Asia Pacific equities and Asia Pacific emerging equities (14% and 84% approximately).
In the IA India sector, managers struggled to beat the most common benchmark, the MSCI India, during the past 10 years.
The only fund to achieve this feat in eight years out of 10 was the $2.5bn Fidelity India Focus fund managed by Amit Goel, who invests in sustainable businesses that are market leaders in sectors that benefit from India’s growth opportunities.
His current overweights compared to the MSCI India Capped 8% Index are financials (6.2 percentage points on top of the index’s 25%) and consumer discretionary (6.2 percentage points on top of the index’s 12.9%), while the main underweights are energy (where the fund remained 6.6 percentage points below the index at 4.1%) and utilities (which the fund doesn’t own but make up 4.6% of the index).
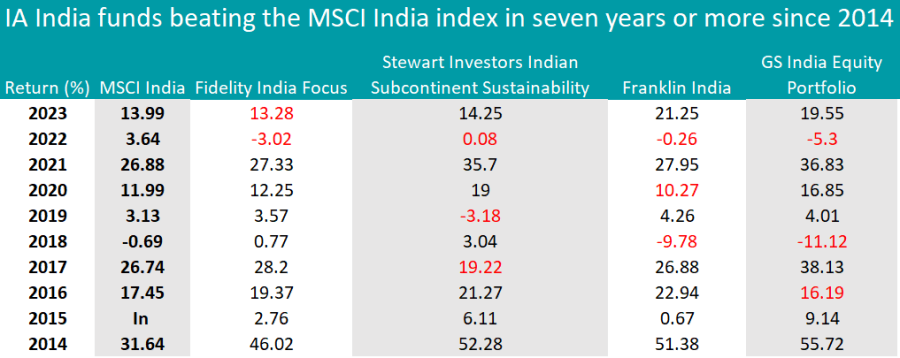
Source: Trustnet. The red highlights represent underperformance against the reference index.
In the IA Japan sector, the Topix index proved to be a high hurdle to beat, with no more than four strategies outperforming it in seven years of the past decade – two of which are from the same provider, Morant Wright.
WS Morant Wright Japan and WS Morant Wright Nippon Yield are two similar strategies (98% correlated to each other), both with a FE fundinfo Crown Rating of five.
The management team is unconstrained from any benchmark and can choose companies across the market-cap spectrum.
The Nippon Yield fund’s value-style approach has become a large headwind in recent years, as Square Mile analysts noted. However, “while this has meant the fund has struggled, it has continued to present superior returns over its stylistic biases,” they said.
“There are risks involved with this strategy and the approach appears simplistic, but we believe this fund is a strong value option with a disciplined approach and focused team.
“The fund would suit investors who want to diversify their Japanese equity exposure but also those that are willing to accept volatility versus the benchmark over shorter periods.”
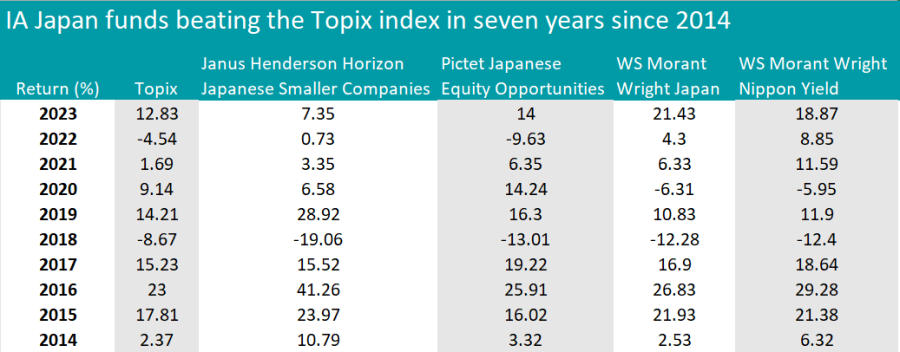
Source: Trustnet. The red highlights represent underperformance against the reference index.
Another strategy of note was the Janus Henderson Horizon Japanese Smaller Companies fund, managed by FE fundinfo Alpha Manager Yunyoung Lee, who has been in charge since 2005.
The portfolio now includes 53 holdings, 28% of which are in the industrial sector. At 14.8%, technology is a slight overweight for the fund against its benchmark, the Russell/Nomura Small Cap index, which has 12% in the sector. The biggest underweight is consumer discretionary (11.9% versus 20.8% in the index).
The only other fund in the table was Pictet Japanese Equity Opportunities, an Article 8 strategy investing in undervalued companies. Its top holdings include Toyota (4.9%), Mitsubishi (3.81%) and Sony (3.3%).
Finally, the standout vehicles in the IA Asia Pacific Excluding Japan sector were Fidelity Sustainable Asia Equity and Jupiter Merian Asia Pacific, both of which outperformed the MSCI AC Asia Pacific ex Japan index in eight years since 2014.
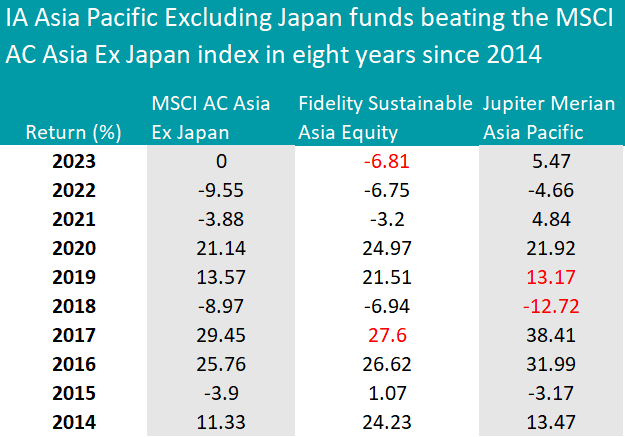
Source: Trustnet. The red highlights represent underperformance against the reference index.
Fidelity Sustainable Asia Equity is an £80m fund managed by Dhananjay Phadnis, who employs a quality-growth approach to select companies with sustainable returns that are mispriced or unrecognised by the market.
Jupiter Merian Asia Pacific, led by Ian Heslop, was described by Rayner Spencer Mills Research analysts as a highly-diversified long-only benchmark-aware portfolio that has consistently outperformed since the current management team took over in December 2011.
“The team has developed a systematic model over time which is now used in seven equity strategies at Jupiter and each of these strategies has delivered top quartile performance since launch with the first strategy dating back to 2005,” they said.
“This tried and tested process gives investors a strong option for investing in Asian equity markets.”
This article is part of an ongoing series on consistency. Previous instalments covered the following asset sectors: Emerging Markets, IA Global, Europe, IA UK Equity, IA UK Equity Income, UK Small Caps, UK bonds, cautious funds, balanced funds, adventurous funds, technology, healthcare and financials.
Jupiter Asset Management has the most Hall of Fame members, with five of its fund managers holding an Alpha Manager rating for at least seven years.
Six active managers have joined FE fundinfo’s Alpha Manager ‘Hall of Fame’ for the first time today, meaning they have earned an Alpha Manager rating for seven consecutive years or more.
The six new entrants are: David Walton, who runs IFSL Marlborough European Special Situations; Claudia Calich of M&G Emerging Markets Bond; Yunyoung Lee at the helm of Janus Henderson Horizon Japanese Smaller Companies; Aziz Hamzaogullari of TM Natixis Loomis Sayles US Equity Leaders; Kristian Heugh, who runs Morgan Stanley Investment Management’s MS INVF Global Opportunity fund, among others; and Polina Kurdyavko, who manages several emerging market debt funds for RBC BlueBay Asset Management.
The Hall of Fame includes 46 managers, seven of whom have been members consistently ever since they joined the group: Richard Woolnough from M&G Investments, John Chatfeild-Roberts and Daniel Nickols from Jupiter Asset Management, David Dudding from Columbia Threadneedle Investments, Martin Lau from FSSA Investment Managers, Mark Slater from Slater Investments and Leigh Himsworth from Fidelity International.
Jupiter has the most managers – five – in the Hall of Fame, followed by Fidelity with four, and three managers each from Schroders, Morgan Stanley and Janus Henderson.
Charles Younes, deputy chief investment officer, FE fundinfo, said: “Those in the Hall of Fame have risen above the market volatility of recent decades, delivering above-average returns during unprecedented circumstances such as multiple economic crashes, a global pandemic and a host of geopolitical conflicts.”
FE fundinfo’s Alpha Manager ratings recognise the top 10% of managers running funds for UK retail investors, based on investment performance during their entire careers. The ratings assess managers’ risk-adjusted alpha, consistency of outperformance versus their benchmark and outperformance in both up and down markets. Managers with longer track records of outperformance are accorded extra weighting in the rankings to recognise the benefits of experience.
Experts explain the differences between the two trusts, share their preferences and suggest strategies to complement them.
F&C Investment Trust and Alliance Trust are among the largest investment trusts in the IT Global sector and have a long history dating back to the 19th century, making them popular choices as one-stop-shops for core exposure to global equities.
Investors might have a hard time choosing between the two, as they seem very similar at first glance. Both take a multi-manager approach, are well diversified and are aligned with global benchmarks from a country and sector perspective.
Historical performance may not help investors distinguish between the trusts, either. Alliance has had the upper hand over the past decade, but F&C has performed better over 20 years.
Performance of trusts over 10yrs and 20yrs vs sector and benchmarks
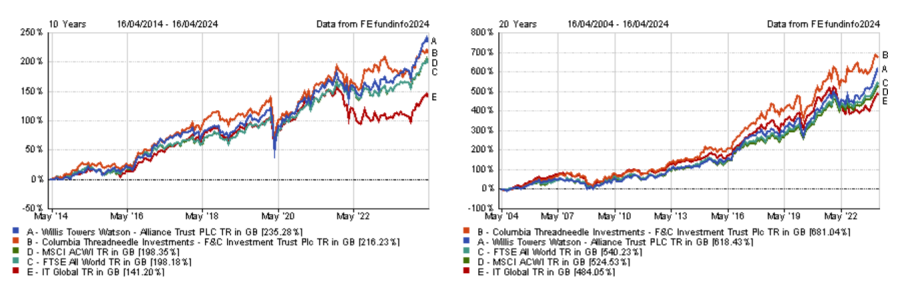
Source: FE Analytics
Trustnet asked experts to explain the differences between the two portfolios, to share which one they favour and to suggest other trusts to complement them.
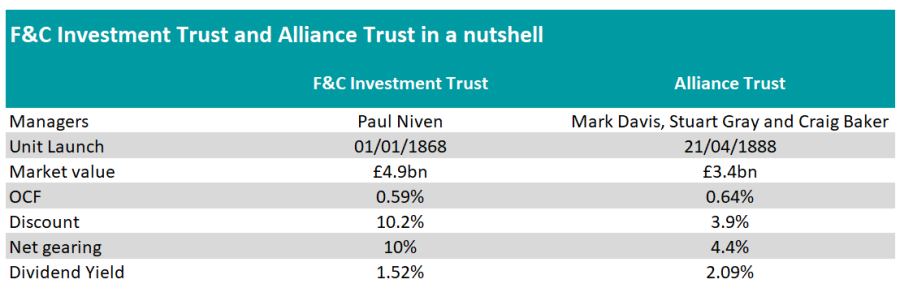
How do Alliance Trust and F&C differ from each other?
Although both funds use a multi-manager structure, there are nuances. F&C invests in funds run by 13 managers, resulting in a portfolio comprising approximately 400 stocks, whereas Alliance Trust uses segregated mandates to get access to its 10 managers’ top 20 holdings.
Aidan Moyle, investment analyst at Hargreaves Lansdown, said: “This gives Alliance a higher conviction approach in their managers’ best ideas and results in a portfolio of 200 stocks from 10 managers. The use of segregated mandates also gives them access to managers that aren’t available to UK retail clients.”
Nicholas Todd, investment trust research analyst at Kepler Partners, countered that using funds makes it easier for F&C’s manager Paul Niven to adjust the portfolio tactically, depending on his outlook.
As a result, F&C has a greater style bias at times, which may impact short-term performance based on whether Niven makes the right call or not.
For instance, the trust significantly underperformed its benchmark over the past 12 months. Niven positioned the portfolio towards value stocks at the beginning of 2023 and missed the ‘Magnificent Seven’ rally as a result, although he shifted to a more balanced exposure during the year.
Performance of trusts over 1yr vs sector and benchmarks
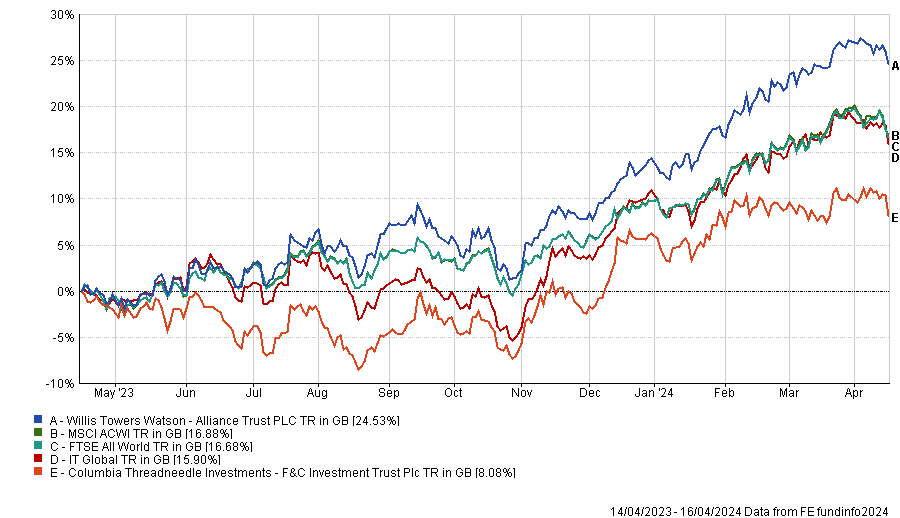
Source: FE Analytics
Another difference is F&C’s exposure to unquoted investments, which has been a “valuable source of alpha” for four out of the last five financial years and offered “good diversification”, according to Todd.
Dan Coatsworth, investment analyst at AJ Bell, pointed out that private companies are less liquid, which may explain why F&C trades on a deeper discount of 10.2% versus 3.9% for Alliance Trust.
Both trusts are ‘dividend heroes’; Alliance Trust has raised its dividend for 57 consecutive years, while F&C has done so for 53 successive years. Yet, Alliance Trust has a bigger dividend yield at 2.05% versus 1.48% for F&C.
Coatsworth said: “Alliance Trust made a strategic decision in 2021 to boost its dividend payments and make the investment trust more attractive to a bigger pool of investors.
“This level of yield is still small versus what’s on offer from equity income-specific trusts but the combination of income and growth is why certain investors want to own the shares.”
Which trust do experts favour?
James Carthew, head of research at QuotedData, said Alliance Trust changed its strategy seven years ago, which was a turning point. The board appointed Willis Towers Watson to run the trust in 2017 and became more aggressive about tackling the discount. Around £1bn worth of shares have been bought back since then.
“Even though Alliance Trust’s new investment strategy is only seven years old, the trust’s returns have already made up the underperformance earlier in the decade. Its 10-year returns have now pulled ahead of F&C’s (12.6% per annum on average to F&C’s 12.0%),” Carthew said.
“It feels to me as though the gap will only get wider. If I had to choose between the two, Alliance Trust is the obvious favourite.”
Mick Gilligan, head of managed portfolio services at Killik & Co, prefers F&C due to its wider discount.
Meanwhile, Moyle believes F&C may be better positioned if central banks cut interest rates due to its 10% allocation to unlisted equities.
“If rates were to start falling, there could be a change in sentiment and investors could start moving more risk-on and increasing exposure to private companies,” he said.
Source: FE Analytics
How to complement them?
As both trusts are highly correlated to global equity benchmarks, Todd suggested complementing them with specialist exposures, such as Allianz Technology Trust.
He said: “It focuses on the tech sector, specifically at the lower end of the market cap spectrum, targeting the ‘picks and shovels’ companies which portfolio manager Mike Seidenburg believes have longer pathways for growth.
“However, there is an allocation to the Magnificent Seven which investors should be aware of as it may limit the diversification benefits. That said, it trades on a discount of 11.6%, which in a notoriously expensive sector looks attractive.”
Performance of trusts over 10yrs vs sector and benchmarks
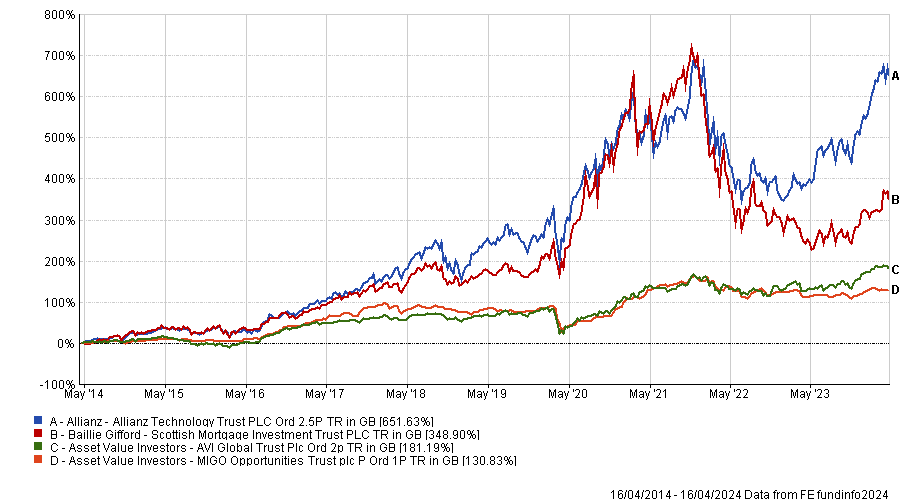
Source: FE Analytics
Alternatively, Todd would consider Scottish Mortgage, AVI Global Trust or MIGO Opportunities.
“The high allocation to private markets in Scottish Mortgage would likely provide a diversifying source of returns and, despite its high volatility, a small allocation of an investor’s risk bucket may be warranted,” he explained.
“Similarly, something like AVI Global Trust or even MIGO Opportunities would offer a good source of diversification and at this juncture look attractive ways to benefit from an easing macro environment given their focus on discounted opportunities.”
As F&C and Alliance Trust are large-cap core portfolio, Todd also suggested adding The Global Smaller Companies Trust, which offers a balanced and core exposure to small-caps.
Performance of trusts over 10yrs vs sector and benchmarks
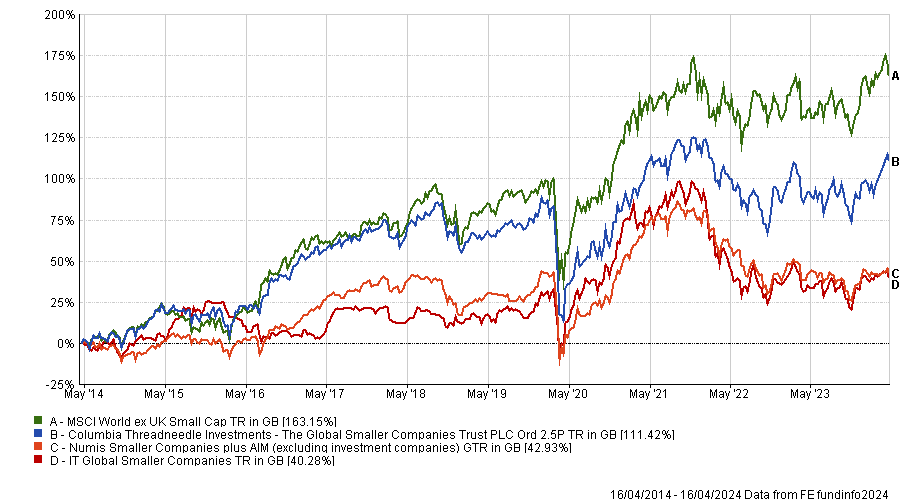
Source: FE Analytics
He said: “There is an 18% allocation to collective investment vehicles to utilise the expertise of managers in Asian and emerging markets, and a 25% allocation to UK smaller-cap equities which have been particularly hard hit.
“The focus is on quality and identifying growth at a reasonable price, which means the managers avoid more speculative areas of the market.
“The trust offers a yield of 1.5% which is rare to see across smaller companies’ strategies and may provide a source of diversification away from typically large-cap focused global equity strategies. A discount of -12.3% may provide an added licker to returns over the long term.”
Any investment trust with a market capitalisation below £200m might be considered sub-scale, although some large investors may even prefer £1bn.
Size is becoming an increasingly important factor in the investment trust market. A larger war chest has always had its advantages because it implies – but not always means – that a closed-ended fund benefits from a stronger liquidity profile, a broader shareholder register, easier access to borrowing facilities, more firepower in terms of discount control and better capital allocation policies.
Moreover, bigger funds can spread their fixed costs over a wider asset base and therefore reduce cost ratios, while scale gives them headroom for share buybacks.
However, another factor contributing to the preference for bigger market capitalisations is the consolidation of wealth management firms. As they are now managing larger sums of money, it can be challenging for them to buy and sell smaller investment trusts.
Elliott Hardy, an investment trust analyst at Winterflood, said: “Wealth managers and institutional investors are better able to invest in larger investment trusts across multiple portfolios/strategies without becoming too large a part of the share register, while funds that see their market caps grow sufficiently to enable inclusion in FTSE indices can benefit from further improved liquidity and passive inflows as a result.”
What is considered sub-scale?
A market cap of £200m is commonly considered to be the bare minimum for an investment trust.
In fact, Winterflood’s latest industry survey revealed that only 62% of investors would consider a closed-ended fund below £200m, whereas a decade ago almost all respondents (99%) were prepared to look at smaller trusts. Meanwhile, 8% of investors now require a size of £400m or more.
Those figures echo the preferences of discretionary investment management firm Quilter Cheviot, which considers anything below £200m as sub-scale and tends to prefer a market cap of at least £250m.
While also seeing £250m as its threshold, Killik & Co indicated that others may even require a size of £500m, if not £1bn.
Few closed-ended funds can pretend to match the latter requirements. Data from Peel Hunt shows that out of circa 300 investment trusts, approximately 50 of them boast a size of £1bn or larger, while 200 have a market capitalisation below £500m and 120 under £200m.
Anthony Leatham, investment companies research analyst at Peel Hunt, said liquidity can be an issue. “The average daily traded value of the trusts above £1bn market cap is c.£6.5m (including 3i Group). For the remaining trusts, the average drops to £670,000 per day.
“This can have a big influence on what is considered sub-scale as it is not just an investment decision but also a risk-management decision.”
Why size can be a misleading indicator
While size has become crucial for many investors, it can be deceptive. For example, size alone does not say enough about the composition of the shareholder register.
Hardy said: “Take for instance a fund with a market capitalisation of £500m but a shareholder register of only five large institutional investors, each with 20% ownership.
“Those incumbent investors may find it difficult to exit the fund without significantly moving its share price – relative to investors within a £250m fund with a diverse shareholder register across institutional and retail investors, each with different investment horizons and motivations for buying and selling at certain times.”
Moreover, a larger size can be a problem for investment trusts focusing on the lower end of the market capitalisation scale.
Leatham said: “In a previous role, I looked at the deterioration of alpha generation from a very large open-ended equity fund and, after detailed analysis, we found the reason – the strategy generated the majority of its historic outperformance from investing in small-caps and, as the fund size expanded rapidly, the ability for the fund to participate in the smaller end of the market reduced and the proportion of the small-cap exposure also reduced.
“Investment trusts are unlikely to experience the same level of growing pains but there is a risk that very large, multi-billion-pound vehicles can become unwieldy and struggle to deploy capital into smaller, less liquid investment opportunities.”
Some investment trusts are aware of this potential issue and try to come up with solutions to avoid building too large positions in their underlying companies. For instance, River & Mercantile UK Micro Cap returns capital to shareholders when its net asset value exceeds £100m.
Where investors can benefit from a smaller market capitalisation
A small market capitalisation is a double-edged sword and can be an advantage for fund managers who may be better positioned to uncover hidden gems.
Leatham said: “If we look at our datasheet and focus on performance by the smaller trusts (<£200m market cap), the top performing 40 trusts have delivered an average share price total return of 22% over the last 12 months, outperforming the FTSE All-Share return of c.7% over the same period.”
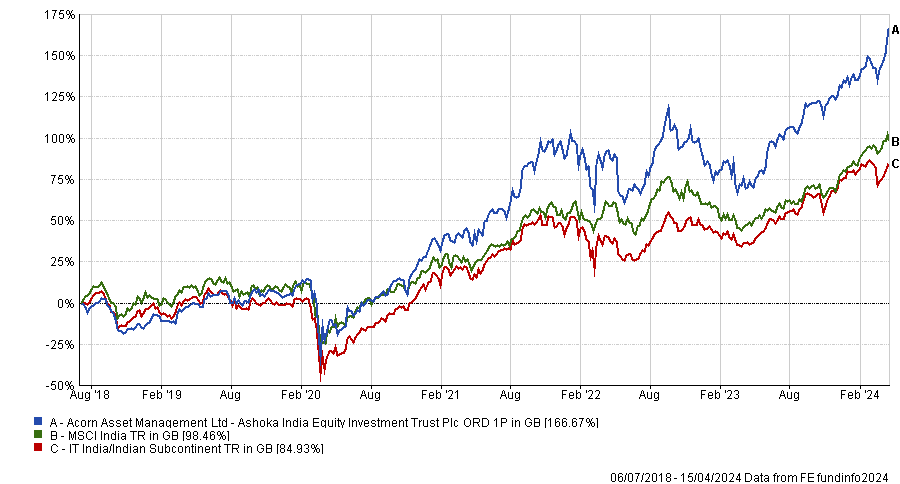
An example he provided is Ashoka India Equity, which launched in July 2018 with a market cap below £50m, but a “clear and differentiated” investment approach and “robust structuring” in terms of fees and discount control.
Fast forward to today, the trust has delivered approximately 22% annualised share price total return compared to 13% for the MSCI India index and boasts a market cap of £378m.
Leatham added: “Investors with a strict size-based exclusion criteria risk missing out on some exceptional investment opportunities.”
Performance of investment trust since launch vs sector and index
Source: FE Analytics
Based on the success of Ashoka India Equity, Mick Gilligan, head of managed portfolio services at Killik & Co, sees good prospects in its stablemate Ashoka WhiteOak Emerging Markets, which follows the same investment process but applied to the whole emerging markets universe.
The trust was launched last year and currently has a market cap of £35m.
Gilligan also likes the previously mentioned £51m River & Mercantile UK Micro Cap to fish into the smaller echelons of the UK stock market.
Performance of investment trust since launch vs sector
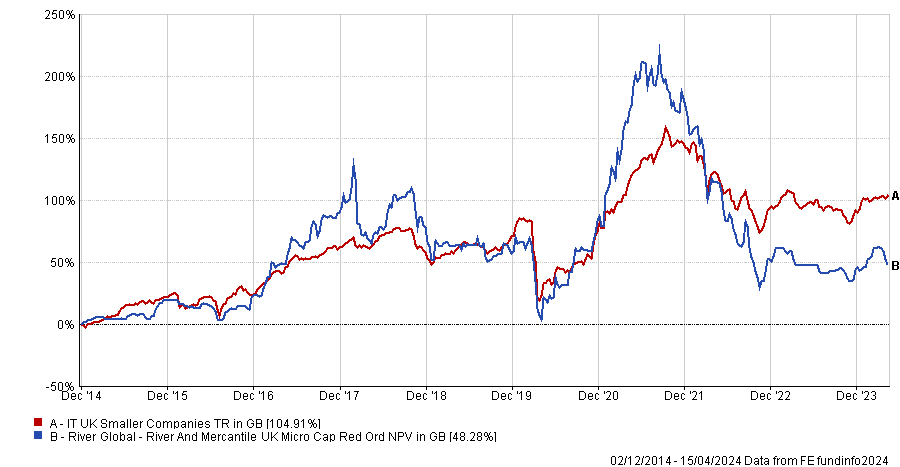
Source: FE Analytics
Finally, smaller investment trusts tend to trade on wider discounts as larger institutional players may be reluctant or unable to invest in those trusts effectively.
As a result, investors may be able to take advantage of such price dislocations or benefit from corporate activity.
Leatham said: “We have seen a notable pick-up in M&A activity recently, particularly combinations with larger or better-rated peers – often including a full or partial cash exit opportunity and often involving a common management entity.
“If size continues to be of importance to investors, then we expect to see further consolidation across the investment trust universe.”
Recent mergers in the investment trust space have included the combination of JPMorgan UK Smaller Companies and JPMorgan Mid Cap, the acquisition of abrdn China by Fidelity China Special Situations and the absorption of Atlantis Japan Growth Fund and abrdn Japan Investment Trust by Nippon Active Value Fund.
Investors should not overlook the domestic market.
The UK market currently offers an unprecedented buying opportunity given valuations are unjustifiably low. This view is well supported by the recent flurry of UK targeted M&A at extremely attractive premiums.
Alongside compelling valuations, there are also signs that the Bank of England will ease its monetary policy as inflation comes under control. We think this backdrop, which gradually moves us on from the more turbulent macro conditions of recent years, should bolster the UK’s appeal to investors.
Investors should therefore not overlook the market standing at these historically low levels, or the many successful British listed companies available at bargain prices that can be tapped into.
Aerospace and defence demand
Whilst most people might associate Rolls Royce with luxury vehicles, the stock is actually a powerful player in the aerospace market. It has become the world’s leading engine supplier in business aviation, powering some of the largest, fastest, and longest-range business jets available.
Today more than 3,300 of these aircraft are in service worldwide, helping companies to improve business efficiency, productivity and enabling economic growth.
Rolls Royce’s new management team has been instrumental in turning the business around, improving both cashflow and profit margins. The firm has also benefitted from increased demand for flight travel in a post-Covid era, with ageing fleets that need ongoing service and maintenance.
Within the sphere of defence spending, which has become a heightened priority in most Western countries, BAE Systems, which provides some of the world’s most advanced, technology-led defence, aerospace and security solutions, is currently experiencing a significant order book as companies seek to address potentially decades' worth of defence underspend.
Consumer manufacturers – hobby miniatures
Games Workshop is the global leader in tabletop miniature gaming with a long-standing reputation for producing 30 million high quality miniatures per year for its iconic Warhammer worlds.
The company is differentiated by its scale, expertise, and control of every aspect of its brands and products from concept and design to manufacture and distribution. As one might expect, the figurines command a very loyal fanbase who tend to purchase new releases as soon as they appear.
Another boost for Games Workshop is set to come from its exclusive deal with Amazon, signed last year, to transform its Warhammer 40k game into a film and television series.
In its half-yearly report, released in January, the gaming firm said revenue reached £247m in the 26 weeks to 26 November 2023, up from £226m in the previous year. We believe the business has good pricing and volume growth which, coupled with unending revenue streams, presents a compelling investment opportunity.
IT solutions in the value-added reseller sphere
Bytes, a recent addition to the portfolio, is a value-added reseller of IT services and Microsoft’s top partner in the UK. As Microsoft has gone from strength to strength, so too has Bytes.
The company goes beyond simply reselling products to small- and medium-sized businesses, by seeking to educate on various tech trends and help clients find suitable technology solutions for their businesses.
It has had huge success selling into the public sector, winning big name contracts with the likes of the NHS. Recent artificial intelligence (AI) developments, such as Co Pilot, present a significant growth opportunity as the tool represents a serious productivity opportunity but requires instruction to use it. Bytes will therefore be able to sell it into their customer base at scale.
Callum Abbot is portfolio manager of JPMorgan Claverhouse. The views expressed above should not be taken as investment advice.
The Bank of America Global Fund Manager Survey reports a significant surge in optimism this month.
Fund managers around the world have become increasingly bullish this month, according to closely watched positioning and sentiment research, with many expecting an economic revival and increased profits.
The findings of the April edition of the Bank of America Global Fund Manager Survey, which polled 224 asset allocators running a combined $638bn, were the “most bullish” since January 2022.
The survey’s broadest measure of fund manager sentiment, which looks at cash levels, equity allocations and economic growth expectations, jumped to 5.8 this month from 4.6.
Percentile rank of fund manager growth expectations, cash level and equity allocation
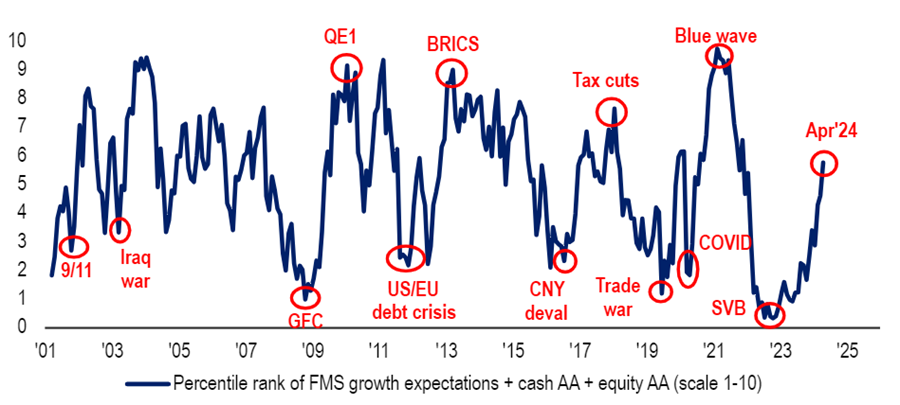
Source: Bank of America Global Fund Manager Survey, Apr 2024
Fund managers have turned bullish on macroeconomics for the first time since December 2021, with a net 11% expecting a stronger economy over the next 12 months. This is a massive turnaround from last month, when a net 12% of respondents thought the economy would weaken.
Some 78% of managers believe a global recession is unlikely within the next 12 months, which is the highest level since February 2022.
Bank of America analysts added: “While global growth expectations are picking up rapidly (to the highest since September 21), they are still playing ‘catch up’ with equity prices.”
Exactly how this growth will look is more polarising, however.
While ‘stagflation’ (or below-trend growth, above-trend inflation) is still the consensus view at 60%, it has come down from the 92% peak in September 2022.
Expectations for an ‘economic boom’ of above-trend growth and above-trend inflation have jumped to 24%, surging from 12% last month and 5% in January.
Just 9% expect ‘stagnation’ (below-trend growth, below-trend inflation) and only 6% expect ‘goldilocks’ (above-trend growth, below-trend inflation).
Meanwhile, a net 20% of asset allocators think profits will improve over the coming 12 months, which is the highest in three years.
Net % of fund managers overweight equities
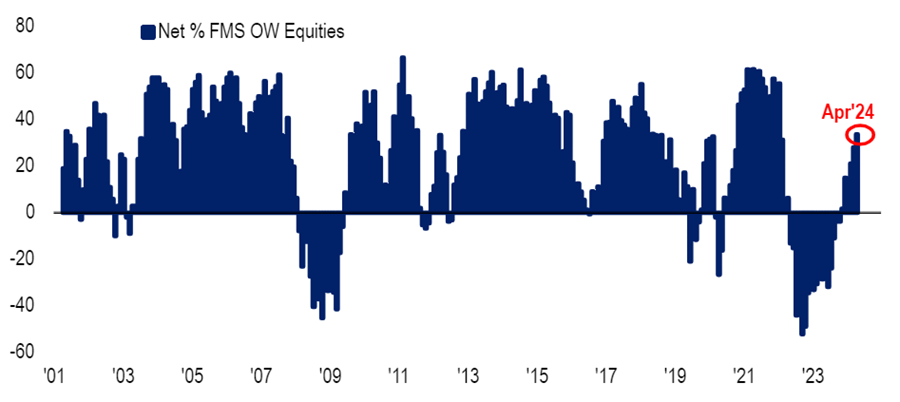
Source: Bank of America Global Fund Manager Survey, Apr 2024
Amid this bullish macroeconomic sentiment, fund managers have taken their equity allocation to a 34% overweight, up 6 percentage points on last month and going to the largest overweight since January 2022.
In April, investors are rotating into materials, commodities, energy and industrials while reducing allocations to bonds, cash, staples and emerging markets, the survey found.
Fund managers’ bond allocation has dropped 20 percentage points since the March survey, which is the biggest monthly fall since July 2003. With a net 14% underweight, investors are now the most underweight bonds since November 2022.
The cash allocation fell 14 percentage points month-on-month to a net 9% underweight, which is the biggest underweight since January 2002.
What fund managers consider to be the biggest tail risks
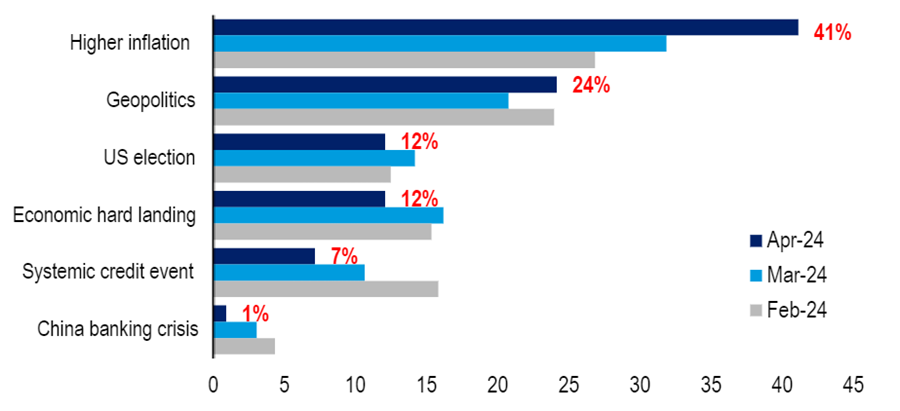
Source: Bank of America Global Fund Manager Survey, Apr 2024
Despite the overall bullish sentiment, there are still some worries keeping managers awake at night.
Some 41% of respondents said higher inflation is currently seen as the largest tail risk, which is higher than the reading last month. Inflation is proving sticker than thought in the US.
Geopolitics is the second tail risk at 24%, reflecting ongoing conflicts in eastern Europe and the Middle East. However, worries around the US election and a hard landing appear to be easing.
BlackRock expects US earnings growth to broaden out beyond tech and is looking for selective sector opportunities in industrials, commodities, healthcare and energy.
BlackRock went overweight US stocks on a tactical horizon of six to 12 months earlier this year and is sticking to its position despite the market hitting all-time highs.
The asset management giant, which is the largest in the world, is confident that artificial intelligence (AI) advances will continue to bolster returns in the technology sector but believes that gains will broaden out into other sectors such as industrials, commodities, healthcare and energy.
A sector rotation is underway. Although the consumer goods and tech sectors have driven earnings growth for the past 12 months, going forward, consumers are starting to show signs of fatigue as their pandemic savings run dry, while demand is improving in other sectors, the firm said.
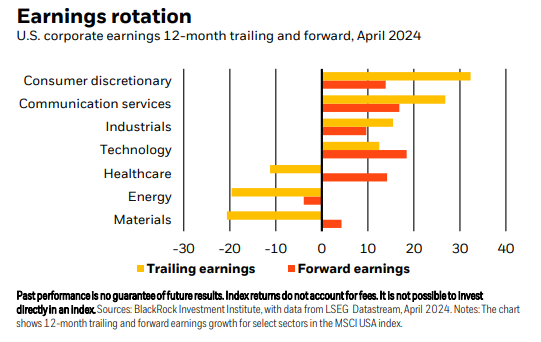
Carrie King, chief investment officer of US and developed markets, fundamental equities at BlackRock, said: “Earnings for energy and commodity producers are picking up after a rough two years. We think higher commodity prices can persist and boost both, with the FTSE/CoreCommodity CRB index up 14% this year and near a decade high.
“Prices of metals key to the low-carbon transition, such as copper, have rebounded and could rise further. We see AI advances stoking the buildout of data centres, resulting in major commodity demand. Companies bringing production closer to home can boost industrials.”
Nonetheless, there are risks on the horizon, including tensions in the Middle East and the potential for inflation and interest rates to stay higher for longer. Against that backdrop, BlackRock views energy stocks as a potential portfolio buffer against geopolitical risk.
“The March acceleration in core services inflation, excluding housing, suggests overall core inflation could rise again sooner than we had expected. The tensions in the Middle East look contained for now but we see risks of further escalation. We could face elevated oil and commodity prices for longer, reinforcing the new regime of higher inflation – and our long-held view that we are in a higher-for-longer interest rate environment,” King warned.
“The question for stocks: will economic and earnings growth stay strong enough to offset that inflation and policy rate outlook?”
So far, solid job gains have supported US economic growth, helping companies to maintain profit margins. “We think market sentiment can stay upbeat if falling goods prices keep dragging down inflation – allowing the Federal Reserve to deliver one or two rate cuts,” King said.
“Nonetheless, after such strong recent performance, the onus will be on US companies to meet already-high expectations this earnings season.”
Analysts are forecasting 2024 earnings growth of 11%, which is well above the 7% historical average, according to data from LSEG.
Felix Wintle, manager of the VT Tyndall North American fund, agrees with BlackRock that stock market leadership is spreading to other sectors. Since the market rally began at the start of November, “mid-caps are working, small-caps are working, there’s been a broadening out of participation,” he said. “We’re actually really bullish.”
This is in stark contrast to last year when “everyone wanted to play defence” but “your traditional defensive sectors were a no go” because utilities, real estate investment trusts and pharmaceuticals were all hit hard by successive rate hikes.
“People just piled into Apple and Microsoft [thinking] ‘I know these stocks aren’t going to blow me up’,” Wintle said. In his 20-year investment career, he doesn’t remember a market being that narrow.
To find the next stock market leaders, Wintle is leaning into the themes of US federal spending on infrastructure, reshoring the semiconductor industry and building out data centres – trends that BlackRock is also monitoring closely.
The VT Tyndall North American fund’s biggest winner this year is Super Micro Computer; it provides the hardware to retrofit and upgrade servers to make them compatible with AI, which uses more computer power than traditional data centres can handle. Since Wintle bought the stock in January it has risen 300% so he is trimming the position.
Share price performance of Super Micro Computer year-to-date in US dollars
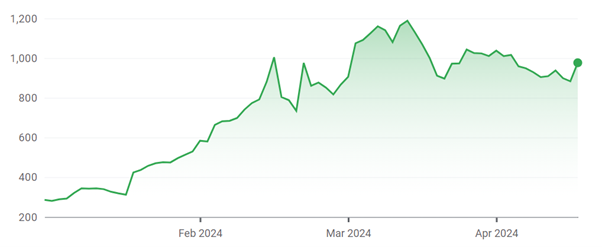
Source: Google Finance
Wintle’s high conviction holdings in other sectors include Celsius, which makes a healthy energy drink, and online sports betting company DraftKings.
The trust for going all-in on Scottish Mortgage’s unlisted holdings.
Investors who are bullish on Scottish Mortgage’s unlisted companies could broaden their horizons and consider the Schiehallion trust instead, which is “the purest version of Baillie Gifford’s private equity holdings”, according to Peel Hunt analysts.
When activist hedge fund Elliott Investment Management entered Scottish Mortgage’s shareholder register with a 5% position last month, Peel Hunt analysts suggested that Elliott’ interest might lie in the trust’s private equity holdings.
“It could be that the hedge fund investor sees value beyond [Scottish Mortgage’s] daily net asset value (NAV) and could be considering further valuation upside from the unlisted holdings,” they said.
The trust’s unquoted portfolio includes names such as Elon Musk’s SpaceX, fintech companies Wise and Affirm, TikTok parent ByteDance and software company Bending Spoons, as well as companies rumoured to be considering initial public offerings (IPOs), including satellite company Starlink, battery developer Northvolt and healthcare specialist Tempus.
But while these companies make up 26% of Tom Slater’s and Lawrence Burn’s portfolio, they represent a whopping 42% of the Schiehallion trust’s assets under management, run by Baillie Gifford’s Peter Singlehurst and Robert Natzler, as shown in the table below.
Top-10 Schiehallion holdings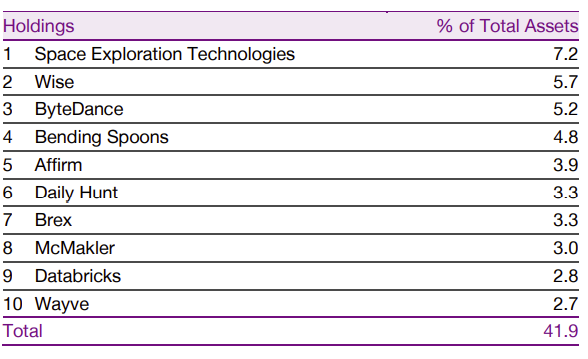
Source: Baillie Gifford
“We look across to Schiehallion for multiple reasons,” the analysts continued. “If the view held by outside parties is that the private company holdings are undervalued, then Schiehallion is the purest version of Baillie Gifford’s private equity holdings, and it’s on a 35% discount to end-February 2024 NAV.
“In the case of Scottish Mortgage, Elliott’s arrival has caught the market’s attention, but investors are left questioning what else there might be to target, given the recent commitment to a £1bn buyback programme and the narrowing of the discount to 5%.”
The hedge fund’s bullish stance on Scottish Mortgage didn’t move the needle either for Shavar Halberstadt, equity research analyst at Winterflood Securities. He remained positive on the trust but said that “the presence of an activist is not necessarily a catalyst we would classify as a reason for investment, although of course any accretive proposals could be helpful.”
Halberstadt also saw the appeal of the Schiehallion trust* for its “substantial exposure to high-quality private companies that are commonly considered prime IPO candidates once market conditions allow”.
“As we approach a probable rate cutting cycle, we expect markets to develop additional risk appetite. There have been some green shoots in the US IPO market recently, and we would not be surprised to see investor interest in Schiehallion ramp up as this widens out,” Halberstadt continued.
That interest won’t necessarily come from Elliott in particular, as “a certain level of scale is prerequisite”, but he expected other activist investors to pile into investment trusts to take advantage of the discounts.
Private equity investment trusts in general are trading at historically wide discounts due to investor skittishness in recent years.
Risk aversion increased due to the extraordinary disruption wrought by Russia’s invasion of Ukraine and other macro factors such as interest rate hikes. Furthermore, given the inherent reduction in visibility and time-lag of reporting compared with listed equities, some investors have been sceptical of private company valuations, Halberstadt said.
“That was understandable. However, private equity investment trusts continued to deliver over 2022 in terms of realisations at substantial uplifts to carrying value, and markets failed to adjust.
“While we saw mild rating improvement over 2023, the sector remains substantially too cheap, trading at a 30% discount to NAV at present versus 15% in January 2022.”
For investors looking to take advantage of those discounts, Winterflood’s 2024 recommendations included Seraphim Space and Pantheon International.
With a share price total return of 60%, Seraphim Space was the top performing investment trust over the year to date. Meanwhile, Pantheon was highlighted by Winterflood’s Elliott Hardy for its “continued a track record of realising assets at an uplift to their underlying value” and its unwarranted 32% discount.
“The fund’s strategic focus over the last decade on secondaries and co-investments should help to support distributions and liquidity amidst record low exit volumes,” he said.
Finally, Quoted Data’s head of investment company research James Carthew recently highlighted Oakley Capital Investments and abrdn Private Equity Opportunities in the private equity space.
The former strategy has been able to generate “robust earnings growth”, a 4% NAV growth and an 18% total shareholder return in 2023. Macroeconomic uncertainty is creating opportunities for Oakley Capital, which “has been busy deploying cash into new investments at what it feels are attractive valuations,” Carthew said.
In January, abrdn Private Equity Opportunities announced a net asset value total return of 5.4% and share price total return of 11.7% in its annual results for the year ending 30 September 2023. These performance disclosures helped to narrow the trust’s discount from 45% last October to the current 28.9%.
“This resilience came in spite of a slowdown in activity in European private equity markets in 2023, dampened by a residual fear of rising interest rates and geopolitical tensions,” Carthew said. “However, as interest rates come down, the market could bounce back quickly.”
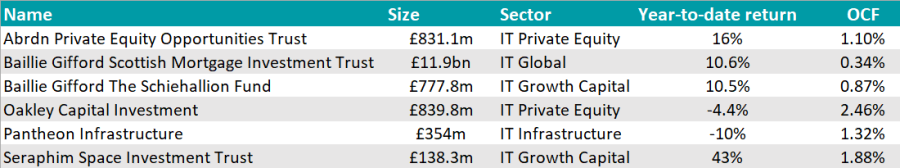
Source: FE Analytics
* A corporate broking client of Winterflood Securities.
Inflation seems to be sticker than previously thought in the UK, new data suggests.
UK inflation has fallen by less than expected, official figures show, adding to concerns that it remains too sticky for the Bank of England to start cutting interest rates any time soon.
According to the Office for National Statistics, the consumer prices index (CPI) rose by 3.2% in the 12 months to March 2024, down from 3.4% in February. While this is the lowest level in two-and-a-half years, it remains above the Bank’s 2% target and is slightly higher than economists were expecting.
CPI annual inflation rates for the last 10yrs
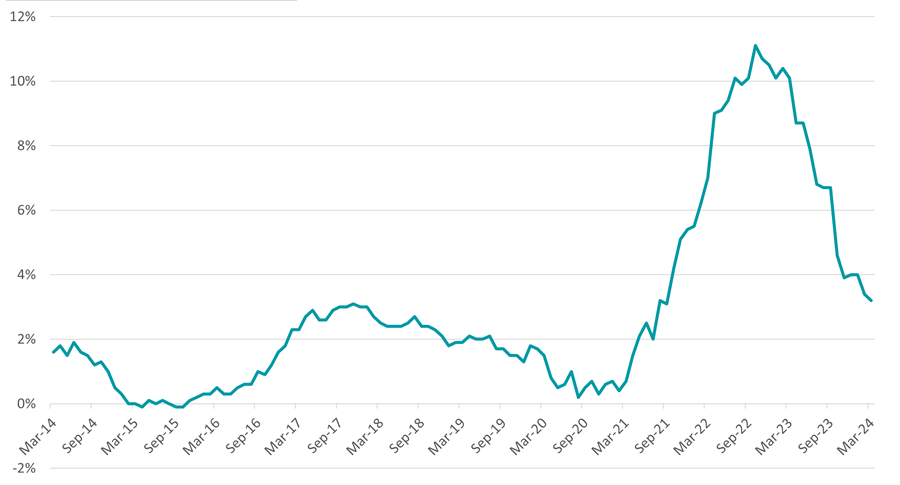
Source: ONS
The largest downward contribution came from food, with prices rising by less than a year ago. Prices for food and non-alcoholic beverages rose by 4% in the year to March 2024, down from 5% to February, although the ONS did flag a small rise in bread and cereal price inflation.
But falling food prices were partially offset by rising fuel prices. Energy prices are once again in the spotlight, with continued tension in the Middle East between Israel and Iran.
Tomasz Wieladek, chief European economist at T. Rowe Price, pointed to services inflation, which fell from 6.1% to 6%, as being “relatively sticky” and suggests the UK’s underlying domestically generated inflation is “significantly stronger than expected”.
“Together with the rising momentum in wage inflation, the sticky services inflation numbers raise the risk the UK inflation battle is far from over and perhaps not yet won. The MPC [Monetary Policy Committee] will be worried about this scenario and I believe this strong reading will make the MPC cautious about cutting early in the summer,” he said.
“Indeed, given these strong domestic inflationary pressures in both wages and services, the MPC will now likely wait until late summer to get the required confidence to cut rates.”
CPI annual and monthly inflation rates by division
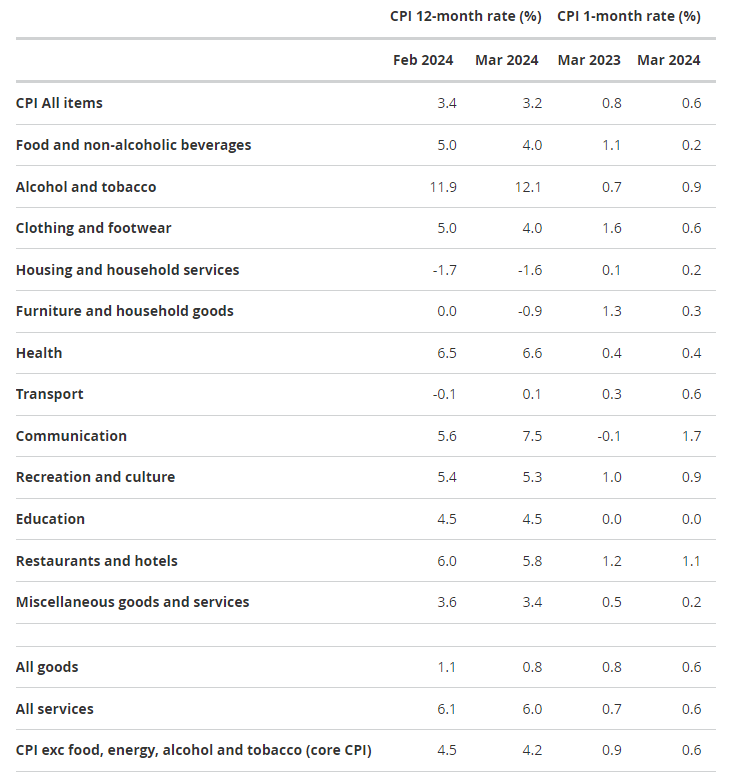
Source: ONS
It had been thought that the Bank would could start to cut interest rates as early as May. The MPC will meet on 9 May although the market is now not expecting the first rate cut until August or September.
That said, Bank governor Andrew Bailey recently reminded the market that inflation does not need to reach the 2% target before the first cut to the base rate, which currently stands at a 16-year high of 5.25%.
“We don't have to actually get inflation all the way back to target… to cut rates for instance, what we have to do is be convinced that it is going there,” he told BBC News last month. “We should act ahead of time in that sense because we have to be forward looking.”
Danni Hewson, head of financial analysis at AJ Bell, said the latest ONS figures show inflation is “moving in the right direction” and should look even better next month, when the falling energy price cap is factored into the calculation.
“This print is unlikely to persuade Bank of England policy makers, who just a couple of months ago were voting for further hikes, that the time is now right to start to cut. Andrew Bailey might be making positive noises about the pieces of the economic puzzle falling into place for a change in policy, but markets are far from convinced,” she added.
“Looking at the numbers after the inflation print was released, expectation of a June cut has fallen back significantly and more than 50% now think even August will be too soon.”
T. Rowe Price’s Wieladek ended on a more pessimistic note, highlighting another risk that is not being widely spoken about in the UK’s monetary policy debate.
“If services inflation and wages continue to remain persistently at these high levels, the risk the Bank of England will have to hike this year is rising,” he warned.
“After all, the Bank of England is data-dependent. If the data continue to indicate policy is not tight enough to bring inflation back to target, the MPC may have to tighten policy further.”
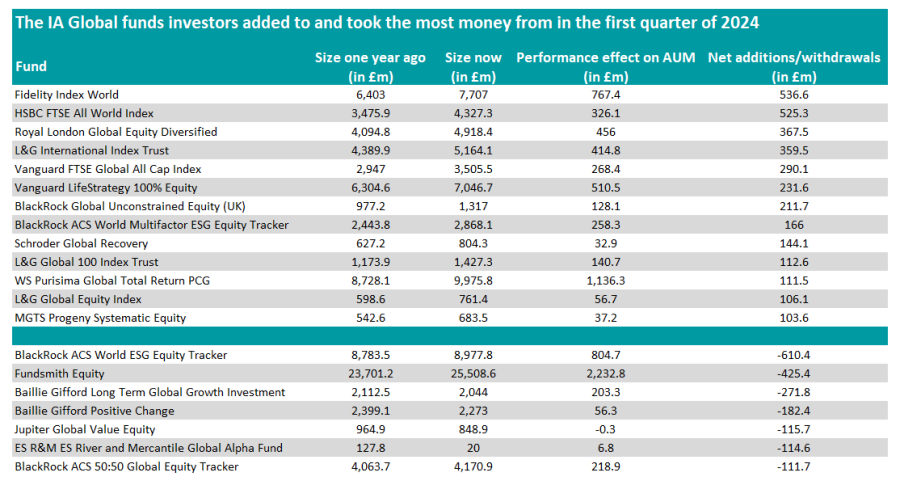
Passive funds were favoured in the first three months of the year.
Investors showed a preference for index trackers in most equity sectors in the first quarter of the year, according to data from FE Analytics.
In the below study, we have looked into the most bought and sold funds in the first three months of 2024 across the different equity sectors of the Investment Association. We have focused specifically on funds where investors added or withdrew at least £100m.
In the IA Global sector, investors took out £425.4m from Fundsmith Equity, although the fund was still able to grow thanks to performance, which added more than £2bn to its assets under management.
The £25.3bn portfolio has fallen out of favour with investors in recent years, as it was the most sold fund in 2023. While Fundsmith Equity has delivered a positive return over the past year, it has, however, lagged its sector. It also failed to beat the MSCI World index over five and three years as well as over the past 12 months. As a result, Bestinvest recently added the portfolio to its list of ‘dog funds’ for the first time ever.
Other growth funds appear among the most sold global portfolios, such as Baillie Gifford Long Term Global Growth Investment and Baillie Gifford Positive Change, which shed respectively £271.8m and £182.4m.
Yet, value funds were not the beneficiaries of this disenchantment for growth strategies, as investors sold Jupiter Global Value to the tune of £115.7m. A reason for this sell off might be the departure of Ben Whitmore who had been managing the fund since its inception in 2018. He is in discussions to keep the fund under his new asset management firm, however.
Source: FE Analytics
Instead, investors favoured passive funds for their exposure to global equities, with Fidelity Index World, HSBC FTSE All World Index and L&G International Index Trust attracting the most inflows.
Royal London Global Equity Diversified, BlackRock Global Unconstrained Equity (UK) and Schroder Global Recovery were the only active strategies that received at least £100m of inflows.
In the IA Global Equity Income sector, Royal London Global Equity Income is the only portfolio in which investors added at least £100m, as they poured £273.5m into it. The other way around, Fidelity Global Dividend and BNY Mellon Global Income shed £613.3m and £ 176.7m respectively.
Fund flows in the IA UK All Companies sector followed a similar pattern, with investors backing passive funds such as BlackRock iShares UK Equity ESG Index (UK), iShares UK Equity Index (UK) and Royal London UK Core Equity Tilt.
Similar to the IA Global sector, investors shunned active funds, regardless of their style bias. For instance, they withdrew more than £300m from growth-oriented strategies Liontrust Special Situations and WS Lindsell Train UK Equity. The latter fund had a disappointing start in 2024, as it is down 1.7% since the beginning of the year.
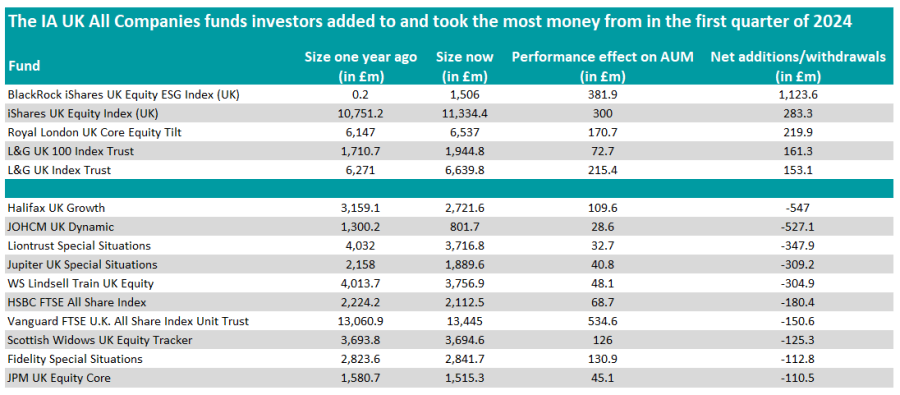
Source: FE Analytics
However, investors also steered clear of value funds, as JOHCM UK Dynamic, whose manager is heading to replace Whitmore at Jupiter, and Jupiter UK Special Situations – another Whitmore fund – also shed more than £300m.
In the IA UK Equity Income sector, investors poured £117.6m into BlackRock UK Income and withdrew £263.8m from Jupiter Income Trust and £162.7m from CT UK Equity Income.
In the US, investors added money into trackers such as iShares North American Equity Index (UK) and HSBC American Index but also bought actively-managed funds, including abrdn American Equity, Thesis TM Natixis Loomis Sayles U.S. Equity Leaders and Premier Miton US Opportunities.
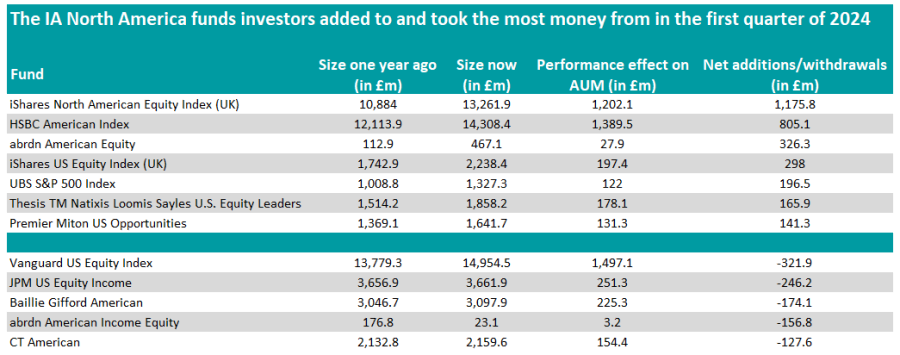
Source: FE Analytics
Meanwhile, Vanguard US Equity Index is the fund in the IA North America sector that experienced the most outflows, followed by JPM US Equity Income and Baillie Gifford American.
In Europe, an active fund – Man GLG Continental European Growth – received the most money from investors, while they also backed BlackRock European Dynamic and Liontrust European Dynamic. Among passive funds, HSBC European Index and L&G European Index Trust were the most popular options.
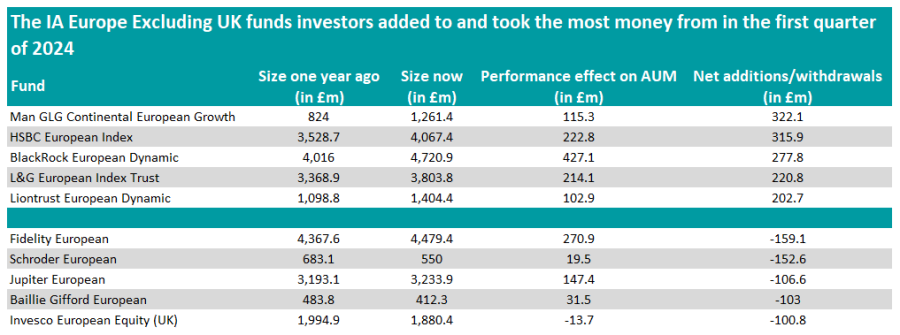
Source: FE Analytics
However, only active funds experienced outflows in excess of £100m, with Fidelity European being the most affected.
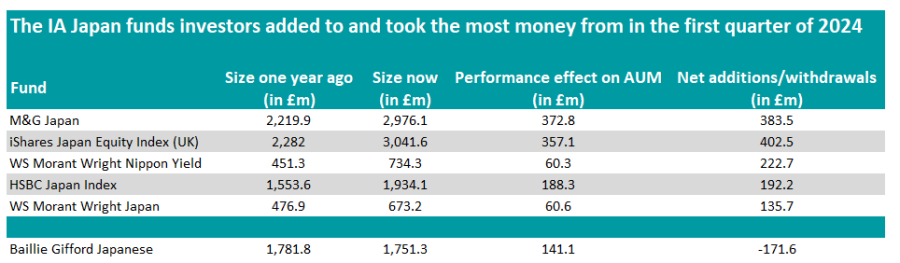
Investors also favoured active funds in Japan. They backed two funds from Morant Wright – WS Morant Wright Nippon Yield and WS Morant Wright Japan – as well as M&G Japan which received ¥73,826.68m (£383.5m) of inflows and index trackers such as iShares Japan Equity Index (UK) and HSBC Japan Index.
Source: FE Analytics
Baillie Gifford Japanese was the only fund in the IA Japan sector from which investors withdrew more than £100m.
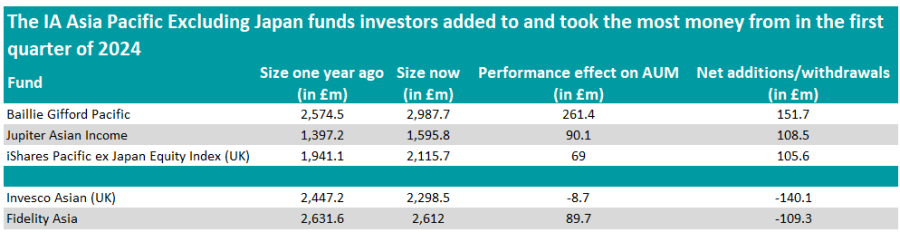
However, its stablemate Baillie Gifford Pacific was the most popular option in the IA Asia Pacific Excluding Japan sector, with investors buying £151.7m worth of units.
Jupiter Asian Income came second in terms of inflows, as it received £108.5m from investors. The fund is known for shunning Chinese stocks while Australia is its largest country weight, with manager Jason Pidcock recently explaining that investors are “too lazy” to look at the country.
iShares Pacific ex Japan Equity Index (UK) was the only passive fund to receive more than £100m of inflows in the first quarter of the year.
Source: FE Analytics
On the other side of the spectrum, Invesco Asian (UK) and Fidelity Asia were the most sold funds in the sector.
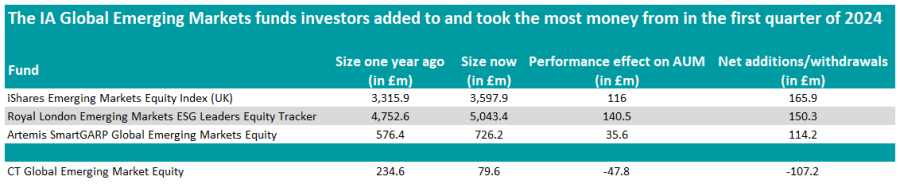
In the IA Global Emerging Markets sector, investors backed tracker funds iShares Emerging Markets Equity Index (UK) and Royal London Emerging Markets ESG Leaders Equity Tracker, whereas Artemis SmartGARP Global Emerging Markets Equity was the only active fund to attract at least £100m worth of inflows.
With outflows of £107.2m, CT Global Emerging Market Equity was the most sold fund in the sector.
Source: FE Analytics
Elsewhere, investors poured £246.5m into Jupiter India, which was one of the most bought funds on the Hargreaves Lansdown and Fidelity platforms in January. Although Indian equities are gaining in popularity in the UK, experts have warned of a potential correction after last year’s rally.
L&G Global Technology Index Trust and L&G Global Health & Pharmaceuticals Index Trust also received £203.1m and £110.6m respectively in the same period.
Although technology has benefited from the artificial intelligence hype in recent times, the healthcare sector has made more modest returns since the Covid rally. Yet, it is one of the few ‘unloved’ areas wealth management firm Canaccord likes, as it is exposed to long-term structural tailwinds.
Finally, investors took out £153.2m from IA Specialist constituent Stewart Investors Asia Pacific Leaders Sustainability.
The manager of the WS Whitman UK Small Cap Growth fund highlights three UK quality-growth small-caps that he believes will emerge stronger from the current turmoil.
UK small- and mid-caps have been the targets of M&A activities in recent years, as valuations have collapsed in this part of the market.
This has reached a point where even quality companies, which were once too expensive for potential acquirers, are now on their radar.
For instance, WS Whitman UK Small Cap Growth – a top ‘young’ UK fund investing with a quality growth bias – has had some of its investee companies taken over in the past two years, including DX Group, Ideagen and Emis.
However, looking for potential M&A targets is not a strategy the manager of the fund, Joshua Northrop, is pursuing. Instead, he is looking to back leading businesses that he believes will come out stronger from this challenging period.
He said: “They are businesses that are taking market share, have better capacity and have invested in their operations. It will really come through in the earnings when we get a better period of economic growth.”
Below, Northrop highlights three UK quality-growth small-caps he feels particularly confident can match his expectations.
JTC
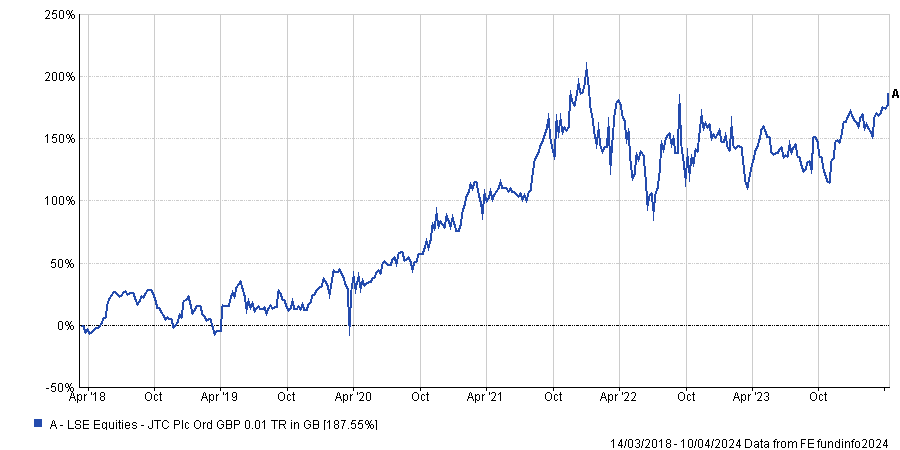
JTC is a FTSE 250 constituent that was launched in 1987 as a provider of fund management services and currently is WS Whitman UK Small Cap Growth’s largest holding.
Northrop said: “What this company does is basically back office and admin for financial services. It is the market leader in those areas. The nature of the business means its revenues are sticky, it has mid-30% EBITDA [earnings before interest, tax, depreciation and amortisation] margin and just reported organic growth of 20%.
“At the peak of the market, JTC traded on 30x price-to-earnings (P/E), but trades now on 18x. To us, this is high quality and good value.”
Performance of stock since listing
Source: FE Analytics
Another thing he finds exciting about JTC is that it operates globally and recently expanded its activities in the US with the acquisition of a business called South Dakota Trust.
Northrop explained: “This business has a very unique position in the US personal trust sector. It is doing trusts administration for 1,700 high net and ultra-high net worth clients. JTC has just acquired it, which gives the company a fantastic ability to cross sell to that client base.“
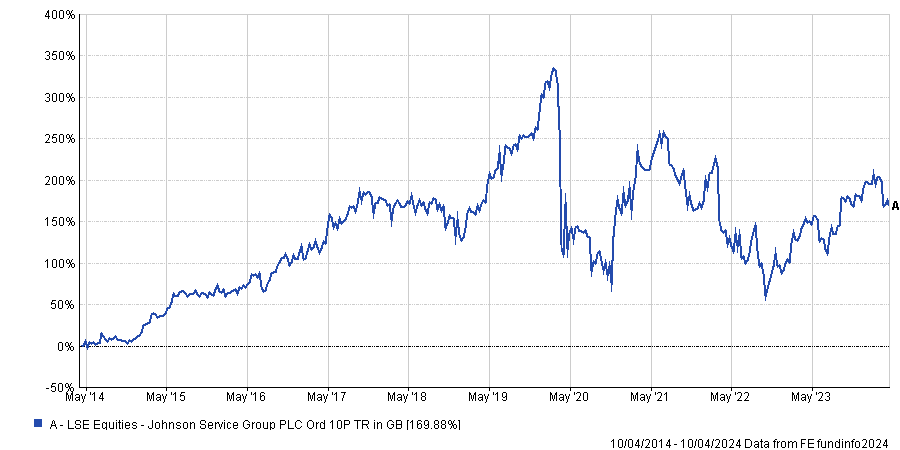
Johnson Service Group
Another stock Northrop highlighted is Johnson Service Group, which is one of the fund’s top five holdings. The company provides textile rental, cleaning and care, but he also highlighted its market leading position in the workwear and hospitality markets.
He said: “It is growing organically and by acquisition. The management team has invested in capacity over the past two years and has opened up a new facility in the southeast for 600,000 items per week. It has also done some M&As with the acquisition of a business in Ireland called Celtic Linen.”
Performance of stock over 10yrs
Source: FE Analytics
Northrop also believes Johnson Service Group’s operating margin is poised to increase in the coming years, as energy prices come down.
He explained that energy bills used to account for 6.5% of the company’s sales but currently stands at 10% because energy costs have surged.
However, he expects operating margin to grow from 10% to 15% when energy bills fall back to 6.5% Johnson Service Group’s sales. He added: “There's a margin story underneath the top line growth story here.”
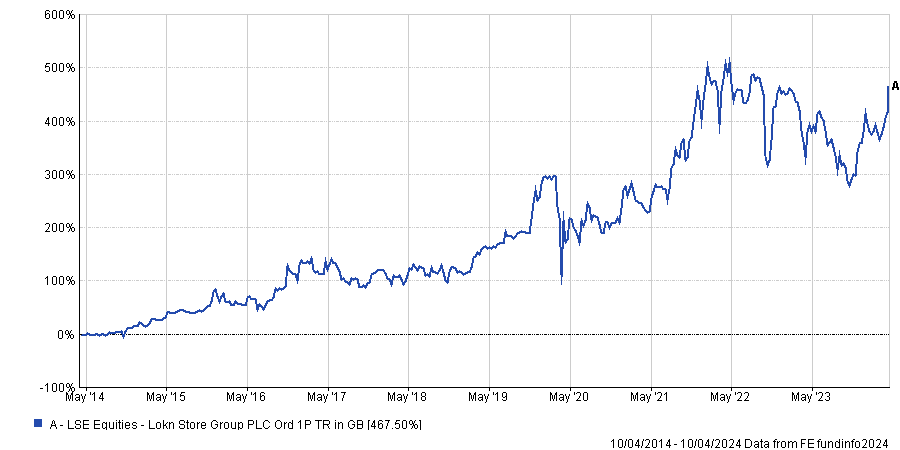
Lok'nstore
A third stock Northrop highlighted is Lok’nstore, which unlike the two previous companies does not feature in the fund’s top five holdings. The company owns self-storage sites and also manage sites on behalf of other owners of self-storage facilities.
Northrop explained that a difficulty in this market is that self-storage sites are expensive to build. However, they are very cheap to run because it does not require a lot of people on-site.
He added: “Lok'nstore owns the vast majority of its sites, but more interestingly, it has a pipeline of new sites. This will lead to a roughly 40% increase in the amount of square footage that Lok'nstore manage and, therefore, a much larger business.
“You can buy this company now at a 20% discount to net asset value, but this net asset value is going to go up over the next six or seven years by at least 50%.
Performance of stock over 10yrs
Source: FE Analytics
While properties in the UK have suffered in recent times, Northrop does not believe self-storage is exposed to the same headwinds.
He explained: “There's a structural under supply of self-storage, which is different from commercial property or other areas of the property market. That’s why we think this discount to NAV is wholly unwarranted.”
Despite this rosy picture, we are also aware that many things could go wrong.
The global growth cycle hit its lowest point in 2023 and is now picking up and earnings estimates have been creeping higher. Although central banks are hesitant to lower interest rates at this moment, they are conveying more accommodative signals to the market, which maintains the prevailing ‘risk-on’ sentiment.
This time last year, California’s Silicon Valley Bank collapsed and sparked a brief banking crisis in the US, roiling financial markets and ultimately claiming a few additional regional bank victims.
Fast forward to March 2024: the St Louis Financial stress index is the lowest since the Fed began raising rates. Bank deposits have stabilised and risen since the 2023 banking panic, showing that confidence in the banking system is returning. What a difference one year makes.
Indeed, while the number of Fed rate cut expectations has moved from seven at the start of 2024 to three as of now, markets do not seem to care: the S&P 500 just crossed 5,200 for the first time ever, the Nikkei 225 index is trading above 40,000 for the first time in three decades, the Europe Stoxx 600 hit new all-time highs, gold is trading above $2,200 for the first time ever, oil prices are creeping higher, copper has suddenly broken out and US corporate bond spreads remain very tight. Last but not least, Bitcoin has hit a new all-time high at $73,000 dollars.
Are we in the middle of a new mania?
To be fair, there are indeed some reasons to be cheerful. First, the global economy is doing better than anticipated. A global manufacturing recovery seems to be unfolding, US consumer sentiment is holding up, China is finally considering deploying more fiscal stimulus, the hard landing scenario seems unlikely and the ‘no landing’ probability is rising.
Better-than-expected economic numbers are propelling earnings estimates higher while artificial intelligence (AI) could trigger a productivity boom which should help keep corporate margins at a high level.
Market dynamics are also sending positive messages to investors: the upward trend remains robust, the participation to the upside is broadening, cyclicals are outperforming defensives and commodities are starting to pick up. Meanwhile, bond volatility is decreasing and the dollar is stabilising.
Finally, investors seem to be cheering the fact that central banks will still cut rates despite the resilience of economic growth and the stickiness of inflation. The ‘reflation’ thesis was corroborated by two important central banks meetings.
First, Bank of Japan Governor Kazuo Ueda decided to end the policy of negative rates. This move was widely anticipated, and the dovish tone around this decision pleased investors and didn’t lead to the yen appreciation which was feared by markets.
In the US, the Fed has kept interest rates unchanged as expected. But there was a positive surprise for investors: as compared to their December forecasts, the Fed is expecting higher real GDP growth (2.1% vs. 1.4%), lower unemployment (4.0% vs. 4.1%) and higher core PCE inflation (2.6% vs. 2.4%), but it is still anticipating three rate cuts this year. This sounds reflationary for markets: as in the case of Japan, the Fed hawks are flying like doves.
This positive mix of decent growth, stable inflation (albeit at a higher level than central bank’s target), loosening financial conditions and upward trending markets with broader participation to the upside lead us to keep our global equity allocation unchanged (with the market effect, our tactical asset allocation to equities is now slightly higher than our strategic asset allocation).
So why not increase our equity allocation further?
Despite this rosy picture, we are also aware that many things could go wrong. The sectors of the economy which are the most affected by higher rates (e.g. US commercial real estate, small- and medium-sized enterprises, etc.) continue to struggle.
Sticky inflation in services and the rise of commodity prices could lead to higher headline inflation in the months to come – hence preventing rate cuts by central banks at a time when global debt keeps ballooning.
A cracking of market heavyweights could lead global indices lower. Geopolitical conflict escalation in Ukraine or Middle East remains a risk. Investor sentiment appears complacent and elevated equity market multiples do not leave any room for disappointment. As such, we are keeping our global equity allocation close to our strategic asset allocation and we won’t be adding more exposure to equities at this stage.
However, we believe some sector and style rotation could continue to unfold. Indeed, the ‘reflation’ thesis might trigger new leadership within equities. We are starting to see some large-cap tech stocks stalling while sectors such as energy and materials have been outperforming the S&P 500 index recently.
Within non-US markets, we are keeping our preference for Japan and staying neutral on Europe. Although momentum in China's equity markets is on the rise, we are currently choosing not to increase our investments in this region.
On the rates side, Treasury supply continues to rise and, coupled with sticky inflation, is exerting upward pressures on long-dated bond yields. In this context, we are decreasing our allocation to government bonds 1-10 years from positive to neutral and the 10 years+ government bonds from neutral to negative. Proceeds are reinvested into cash which continues to offer positive real yields.
The downtrend in credit spreads has continued towards multi-year lows. We remain neutral on credit with a preference for quality (investment grade). On an aggregate basis, our fixed income positioning has moved from neutral to negative.
Within commodities, we are maintaining our allocation to gold. The resilience of the yellow metal despite higher rates and exchange-traded fund outflows is remarkable. Gold continues to offer a protection against geopolitical shocks and currency debasement. The recent technical breakout seems to indicate further upside ahead.
In Forex, we are keeping our neutral stance on the euro, Swiss franc and pound against the dollar. Central banks on both sides of the Atlantic seem to be on a wait and see mode for the time being. We still believe that the change in monetary policy in Japan (raising rates at the time other central banks are contemplating a cut) could lead to some yen appreciation – hence our positive view on the yen versus dollar.
Charles-Henry Monchau chief investment officer at Bank Syz. The views expressed above should not be taken as investment advice.
While being underweight domestic stocks has hurt active managers, a white paper from the asset management house argues that this positioning could eventually pay off.
New research by Invesco claims to have found the reason why active UK funds have underperformed trackers over the past few years, but argues that this might not be a disadvantage over the long run.
The recent underperformance of UK funds has been stark, with the average IA UK All Companies fund making a total return of just 14.5% over the three years to the end of 2023 compared with a 28.1% gain from the FTSE All Share index. Only 40 funds out of 208 in the sector beat the index over this period and 12 of those were passives, mainly tracking the FTSE 100.
In a white paper entitled Active management of UK equities: Understanding historical underperformance and identifying long term opportunity, Invesco UK equities product director Neville Pike and EMEA investment analysis manager Miguel Ucha aim to identify why this underperformance has occurred and ask if active management still offers value to investors.
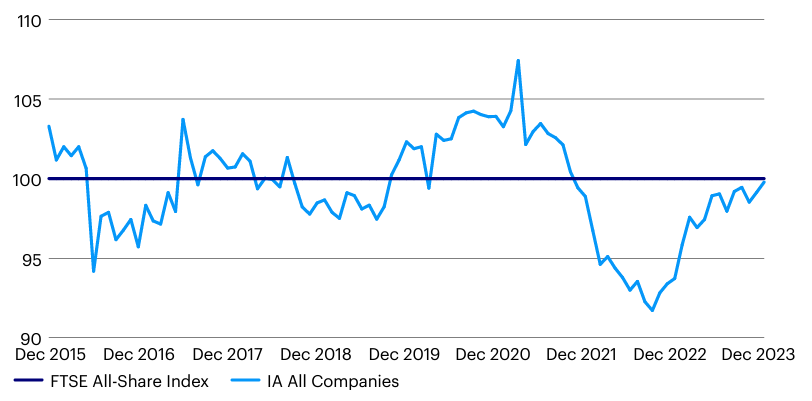
Total return of IA UK All Companies funds relative to FTSE All Share over rolling 12 months
Source: Invesco, Investment Association
Looking back over history, Pike and Ucha found that this underperformance is not typical – in fact, the IA UK All Companies sector was ahead of the FTSE All Share in almost 60% of the rolling 12-month periods between December 2015 and October 2021 (shown in the chart above).
“Peak relative outperformance by the IA sector occurred in March 2021, but active performance then faded such that by September 2022, there had been a swing of 16 percentage points in favour of the FTSE All Share index,” they said.
“Relative performance of active management vs the index therefore appears to move in cycles. The rotation that we can observe over the past three years in favour of the FTSE All Share is not unusual in its incidence. But what sets it apart from previous rotations is its magnitude.”
Putting the past three years under the microscope to explore this further, Invesco created a portfolio of (which it calls Model IA) of the top 50 holdings in the sector for each month in the three-year period. It compared this to the composition and performance of the FTSE All Share.
“The clear inference from this analysis is that the average fund manager represented in the IA sector is significantly underweight a relatively narrow base of the very largest companies in the FTSE All Share index, with active overweights spread more broadly across a larger number of smaller companies (not just in small- and mid-caps) below the top tier,” the paper argued.
The table below shows the biggest underweights among IA UK All Companies funds and how they have impacted performance relative to the index.
Impact on total return from weight differences between FTSE All Share and IA All Companies
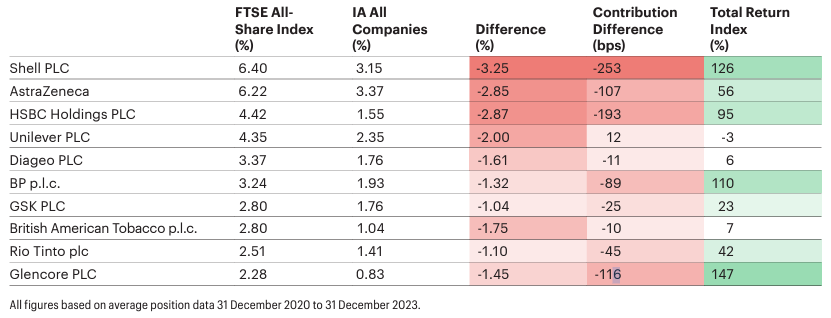
Source: Invesco, Factset, Morningstar
Invesco estimated around 95% of the underperformance of the Model IA relative to the FTSE All Share resulted from being underweight the 10 largest positions in the index.
In a separate note, Rathbone UK Opportunities Fund manager Alexandra Jackson pointed out that the UK market is very concentrated even when compared with the US, with the FTSE All Share’s top 10 stocks accounting for 40% of its weight. This causes problems for active managers.
“These top-heavy indices make it hard for active managers to be ‘at weight’. Doing so would mean jettisoning reasonable diversification and taking on huge risks that wouldn’t benefit investors. In some cases, it would nudge close to, or even exceed, regulatory limits on position sizes,” she explained.
“High concentration also means that performance (for good and bad) is driven by an ever-smaller group of stocks – in the UK, for example, the top end of the market is dominated by a few, very mature, often ex-‘growth’ names (albeit ones paying big dividends). Lots of oil, mining, banking, tobacco and consumer staples – but no technology. This seems to crowd out dynamism as well – in the UK, at least – with few changes to the top-10s from year to year.”
In addition to this, Invesco’s white paper suggested that UK active managers are underweight the largest companies because global/pan-European strategies and UK trackers (which tend to be benchmarked against the FTSE 100 so have an even greater weighting than the All Share to the biggest constituents) are essentially reducing the availability of stock for domestic funds.
“The overall conclusion is that, for reasons associated with ownership of some of the largest UK listed companies in non-UK funds, and the growth in passive funds tracking the FTSE 100, the opportunity set for active managers is structurally very different from the FTSE All Share and weighted more to companies below the top quintile” Pike and Ucha wrote.
The above explains why active UK funds are underweight the large-cap stocks that have led the market over the past three years but the paper warns this should not necessarily be seen as a long-term disadvantage.
Total return relative to FTSE All Share (Indexed, 31 Dec 1993=100)
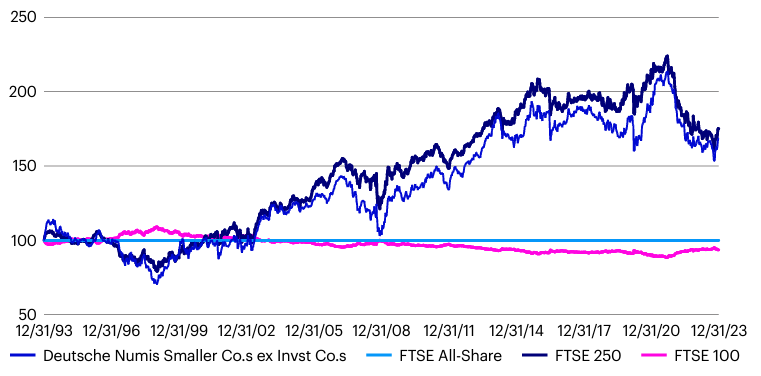
Source: Invesco, Factset
While the past three years have witnessed the significant underperformance of the small- and mid-cap indices, and outperformance of the FTSE 100 (thus the underperformance of active funds), the opposite is true over the long run – as shown above.
“There have been times (in the build up to the first dot.com boom, during the global financial crisis, around the Brexit Referendum of 2016, the first wave of Covid in April 2020, and the most recent period since September 2021) when smaller and mid-caps have underperformed,” the research finished.
“But the long-term outperformance of smaller and mid-caps, and the ‘oxygen’ of increased volatility that fuels opportunity for stock picking, suggests that the long-term outlook for UK active managers, relative to passive funds, remains especially attractive.”
Active managers outside of Invesco agree, with Rathbones’ Jackson liking the opportunities created by the FTSE 250. Just 11% of the UK mid-cap equity index is in its 10 largest names, so it is well-diversified, and Jackson believes this means it is home to quality companies “flying under the radar”.
“Many of these businesses are little known, with strong opportunities for growth both at home and abroad,” she said. “And they seem cheap relative to their counterparts in other markets and when compared with the past.”
Over at Premier Miton, Gervais Williams thinks markets could be approaching “an explosive period of small-cap recovery”.
With the very strong performance of global mega-caps such as Microsoft, Apple, Tesla and Novo Nordisk being driven by “an unusually large rise in their valuations” rather than earnings growth, Williams sees them as being vulnerable to a snap-back.
“The key point is that quoted small-caps have already had their bear market. They’re already standing on absurdly sub-normal valuations because capital flows over recent years have skewed so heavily into mega-caps,” the Premier Miton UK Smaller Companies co-manager said.
“Reallocating just 1% from mega-caps to small-caps dramatically scales up its impact, so the new small-cap supercycle is currently on a hair trigger.”
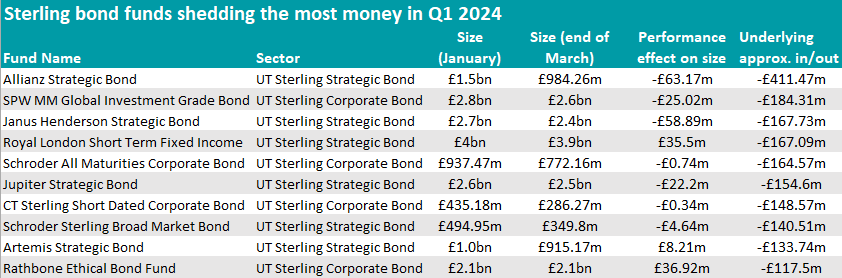
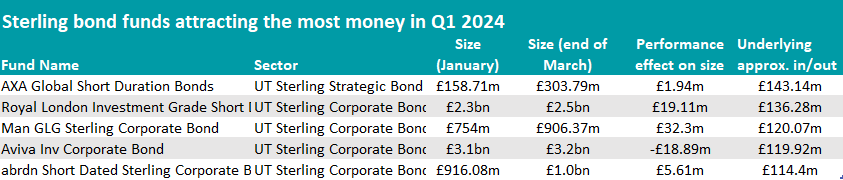
Latest data reveals which sterling bond funds have lost or gained investors’ confidence so far this year.
Taking macro views sometimes pays off and at other times is hard to get right. Mike Riddell’s Allianz Strategic Bond fund and John Pattullo's Janus Henderson Strategic Bond fund have been on the latter side of the equation lately, with investors taking money out of the funds and putting it instead into short-duration strategies.
This is what emerged from the latest FE Analytics data on fund flows for the first quarter of 2024.
The largest sum was withdrawn from Mike Riddell’s Allianz Strategic Bond fund, which shed almost half a million in 2024 (£411.5m to be precise, exacerbated by £63.2m in performance-related losses).
Performance of fund against sector and index over 1yr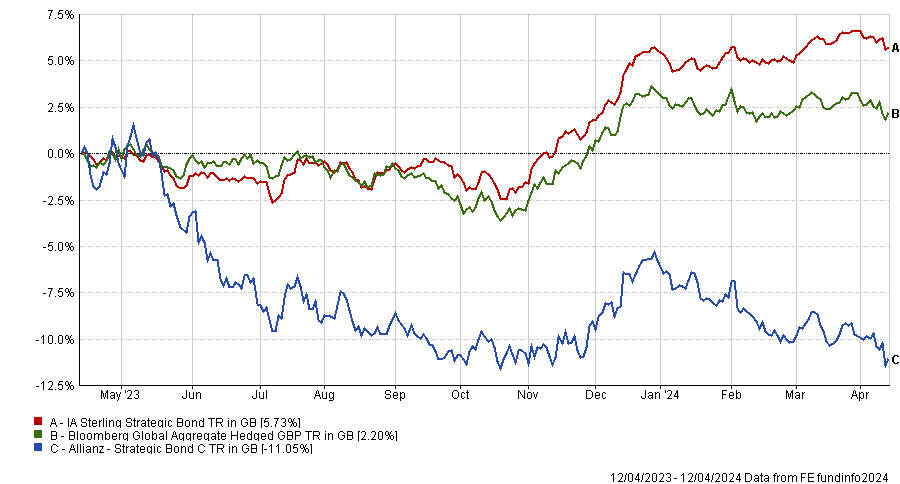
Source: FE Analytics
The strategy has come down from its heyday in May 2021, when it had amassed a £3.5bn war chest, to today’s £962.4m in assets under management. Part of this decline is down to the manager’s ultra-defensive stance, whose preference for the longer-maturity part of the market hasn’t paid off.
Despite this, FE Investments analysts continue to rate the fund.
“Riddell has been able to time fixed-income markets impressively for the most part, often by implementing contrarian views that have driven superb performance over the long term,” they said.
“More recently the timing of some of the team’s market calls has proven premature, meaning the fund has struggled to maintain pace with the benchmark. Nonetheless, Riddell is able to clearly articulate and justify the ongoing active bets in the portfolio.”
Source: FE Analytics
Remaining in the IA Strategic Bond sector, Janus Henderson Strategic Bond was also penalised by investors, who took £167.7m out of the fund. Performance hasn’t helped, and assets under management (AUM) have shrunk from their peak of £3.4bn in November 2021 to the current £2.3bn, as shown in the chart below.
Despite the recent struggles, FE Investments analysts spoke positively of the strategy.
“Accurate economic analysis is key to the fund’s performance. This is something that is hard to get right every year, but the team has a strong track record in market calls, albeit interest rate positioning proving particularly costly over 2022,” they said.
“It is a good option for those who want a manager capable of being flexible with their bond allocation depending on the macroeconomic environment.”
Fund size since peak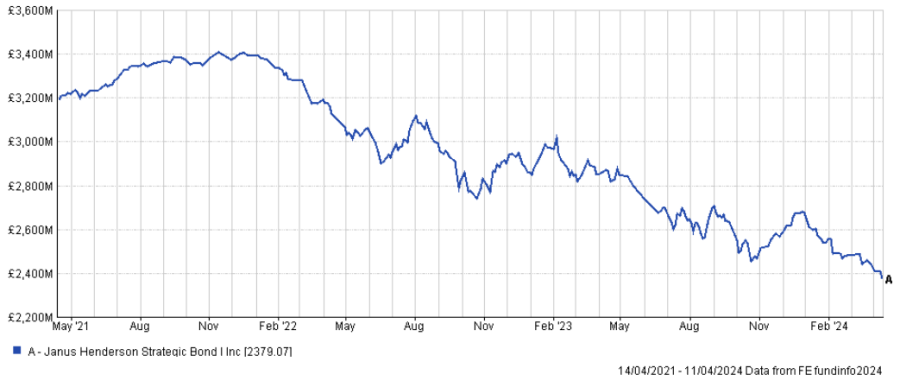
Source: FE Analytics
The Royal London Short Term Fixed Income fund also had to part with a similar sum (£167.1m) but was one of the few funds to add some money through performance (£35.5m).
In that, it was only outdone by the Rathbone Ethical Bond Fund, which focuses on corporate bonds and returned £36.9m between January and March this year.
In the IA Corporate Bond sector, Schroder All Maturities Corporate Bond and CT Sterling Short Dated Corporate Bond also suffered similar outflows.
While 10 funds lost more than £100m, only five managed to do the opposite and added the same amount or more.
Most of them were short-duration strategies, which have been going through a renaissance, profiting from anticipated rate cuts.
Here, the AXA Global Short Duration Bonds fund attracted the most buyers.
The portfolio can now count on an extra £143.1m of investors’ money, which almost doubled the fund’s AUM, taking it from £158.7m to £303.8m.
It is run by FE fundinfo Alpha Manager Nicolas Trindade and Nick Hayes and was highlighted by Square Mile analysts as an “attractive fund for investors seeking some income and the potential diversification benefits that investing in fixed income can bring without the volatility of a full duration product.”
Source: FE Analytics
The largest and most popular fund in the list was Royal London Investment Grade Short Dated Credit, which added £136.3m to the £2.3bn it had at the beginning of the year.
It has been growing consistently since 2021, when its portfolio was worth £1.4bn. In the past 12 months, it returned 7.2% against the sector’s 5.8%, as the chart below shows.
Performance of fund against sector and index over 1yr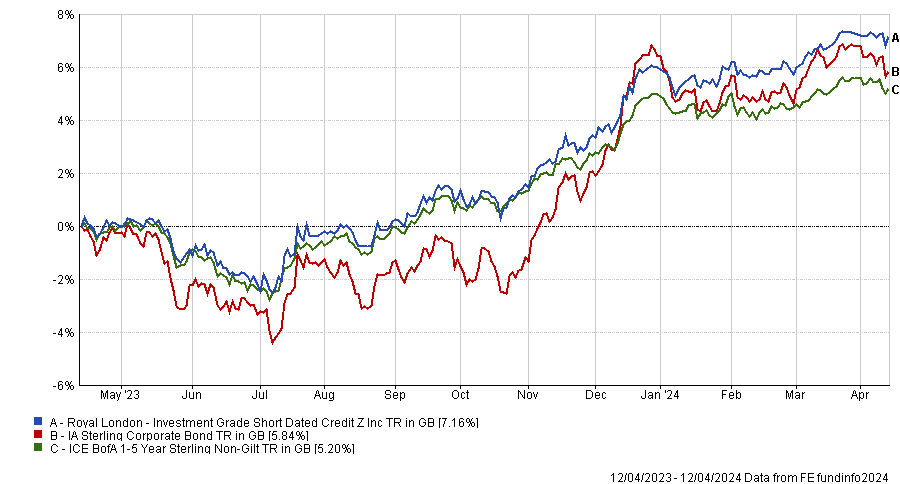
Source: FE Analytics
The best returns, however, were made by the Man GLG Sterling Corporate Bond fund, which gained £32.3m from investment performance and attracted £120.1m in inflows between January and March.
It is managed by FE fundinfo Alpha Manager Jonathan Golan, a “young, talented fixed income manager, passionate about credit selection”, as Square Mile analysts described him, who moved to Man GLG and launched this fund in September 2021.
“Different from many other funds in the sterling corporate bond space, this fund's edge lies in its bottom-up focus on smaller issuers and the team's ability to extract alpha from undervalued credits which are overlooked by larger scale investors,” they said.
“This fund is for those investors looking to access strong returns from the sterling corporate bond market but are willing to endure periods of elevated volatility.”
Aviva Inv Corporate Bond also attracted more than £100m of inflows, as did the passive abrdn Short Dated Sterling Corporate Bond Tracker fund.
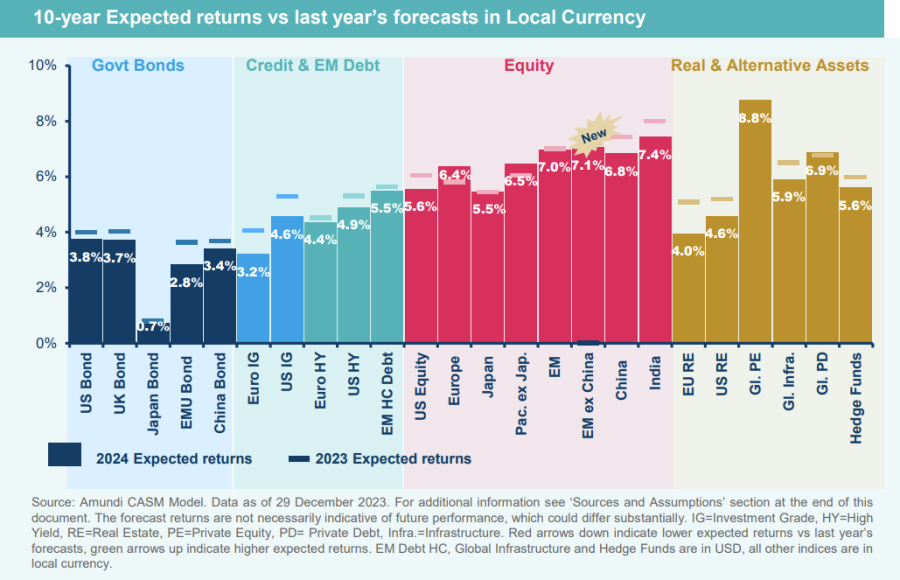
Amundi analysts suggest emerging markets outside of China will flourish, while the US and Japan struggle.
US stocks will make the second-lowest returns of all major markets over the next decade, according to data from Amundi, which forecasts expected returns over 10 years based on current valuations.
It downgraded its expectations for future US gains compared to last year’s forecast “on the assumption that, although the US could continue generating solid earnings per share growth, the market has almost entirely priced in growth expectations, particularly in certain parts of the market (mega caps)”, said Viviana Gisimundo, head of quant and multi-asset solutions at Amundi.
She suggested investors will “have to look deeper within markets in the search for the most appealing opportunities”.
The US is anticipated to make 5.6% per year for the next decade, but other regions such as Europe (6.4%) and Asia Pacific excluding Japan (6.5%) could be a better place to invest thanks to higher earnings per share growth and dividend yields.
However, the US is not expected to be the worst performing market. That falls on Japan, which has been a darling of late as investors have rushed in to take advantage of corporate governance reforms, stock market gains and the improving economic backdrop.
“With regards to Japan equity, although new corporate governance rules are supportive, the Japanese market maintains lower growth potential compared to other developed markets,” Gisimundo said.
The big winner was emerging markets, where Amundi has retained its slight preference versus developed peers, although she warned that performance can be volatile.
“Within the emerging market basket, we anticipate a shift in preferences, as potential growth will be driven by countries other than China,” Gisimundo said.
Indeed, Amundi has added an emerging market excluding China index for the first time into its analysis, which is expected to make 7.1% per annum, bolstered by India, which is the highest returning market on the list at 7.4%.
“We remain cautious about Chinese fundamental and macro assumptions (reflecting the most recent update on the long-term inflation environment),” she said.
“While acknowledging China’s elevated uncertainty, we assume extreme valuations can provide a partial tailwind, particularly for the onshore market.”
The research looks at asset class return expectations in local currencies without considering foreign exchange, which can significantly alter the performance profile.
Turning to bonds, Gisimundo noted that yield curves remain inverted but she expects these to steepen in the medium term as monetary policy normalises.
“More expensive valuations should cause reductions in bond indices’ expected returns and term premiums (particularly in core Europe), while they have slightly improved in Japan, however, where expected returns remain at the low end of the spectrum,” she said.
In credit markets, spreads are “significantly narrower” than their long-term levels and, as such, she expects this to widen out over the medium-to-long term, which should lead to lower returns than had been expected a year ago.
“Overall, the outlook for fixed income assets remains positive, particularly relative to the other asset classes and notably for the high-grade segment and emerging market bonds,” Gisimundo said.
However, she cautioned that although return expectations are greater for high yield than for investment grade bonds, this relative advantage “does not compensate for the higher intrinsic risks”, particularly in the US market.
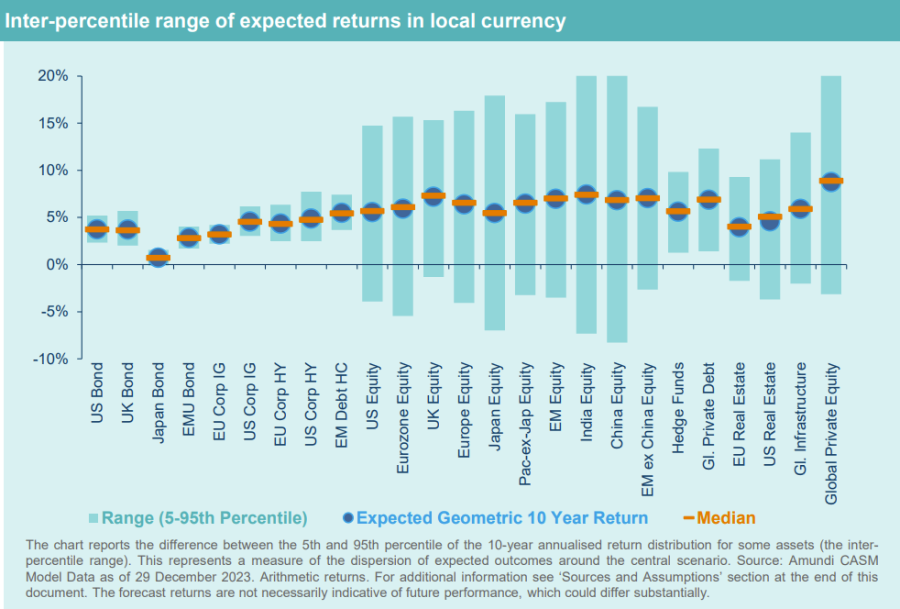
The firm also produced a chart to highlight the potential range of outcomes that could take place over the next 10 years, as well as the average. Here, although the US has a lower upside than some of the other markets, it has a much better downside.
Japanese, Indian and Chinese equity have the greatest potential downside risk, according to Amundi’s calculations. “Dispersion increases notably when comparing single emerging countries such as India and China versus emerging market aggregates,” said Gisimundo.
“It is key for investors to understand that for some equity and alternative assets, there is a 5% chance of experiencing negative returns over the next decade.”
Bonds typically have a narrower range in comparison to riskier assets such as equities and alternatives.
Lastly, on the economic front, Amundi said fundamentals have slightly improved from last year, but noted the new 10-year expected returns are, on average, slightly lower than last year’s forecasts after taking starting valuations into account, which are now “more stretched”.
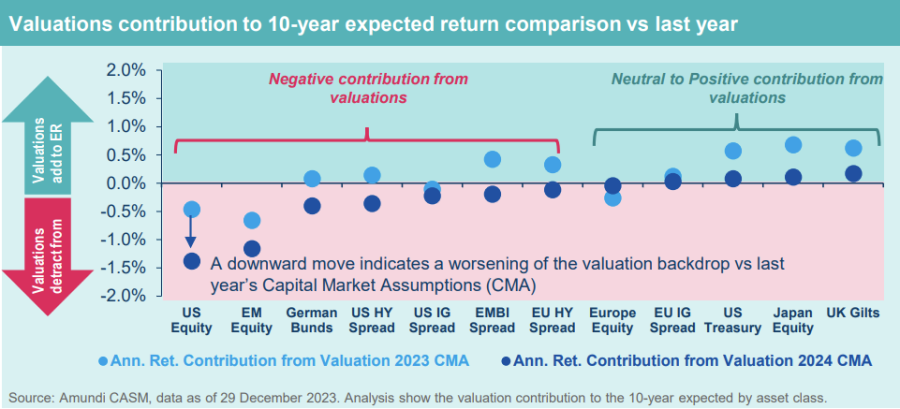
Overall, she said bonds will continue to be a “key engine” for portfolio returns, while in equities diversification will be key as markets will be more volatile. Emerging markets excluding China are favoured here, while private equity could also be considered for those with a higher risk appetite.
The FTSE 100 broke through 8,000 last week and Peel Hunt analysts suggest this could be a good opportunity to back the domestic market.
It has been a slow start to the year for UK stocks, which have lagged all other major indices, but the FTSE 100 broke through 8,000 last week, suggesting the tide could be turning, according to analysts at Peel Hunt.
Although the main UK index is last among other major markets over the year to date, as highlighted by the chart below, there are reasons for optimism.
“We see some exciting opportunities to gain access to the UK equity recovery in some well-established trusts with excellent long-term track records trading on attractive valuations,” they said.
Performance of indices over YTD
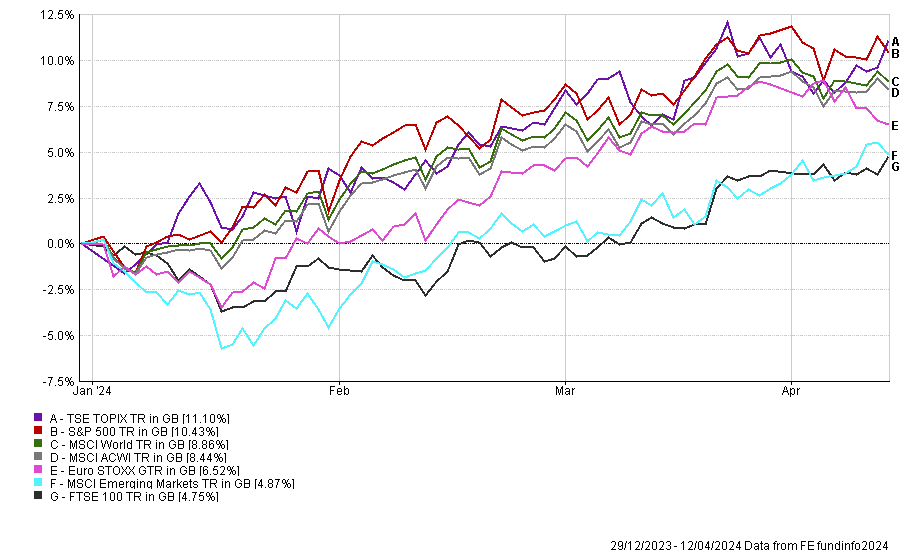
Source: FE Analytics
One option is Law Debenture, which has been in the top or second quartile of the IT UK Equity Income sector in each of the past five calendar years. Last year it made 8.1%, placing it in the top five of the 19-strong sector.
Although the discount “remains relatively narrow at 2%” the proposed dividend for this year has risen to 4.9% and a 10-year dividend compound annual growth rate of 7.9% make it “an attractive proposition”, the analysts said.
Law Debenture combines an investment trust with an independent professional services (IPS) business that provides structured finance services, pensions trustee advice, corporate secretarial services and other business critical activities.
“Over the past decade, the independent professional services business, which represents 20% of net asset value (NAV), has funded more than 30% of Law Debenture’s dividends,” they added.
The trust, which is a corporate client of Peel Hunt, has the highest five-year dividend growth in the UK equity income sector, supported by its “unique structure”.
“The consistent growth and cash generation of IPS facilitates an unconstrained investment approach, accessing the full opportunity set in an undervalued UK equity market,” they said.
Performance of fund vs sector over 10yrs
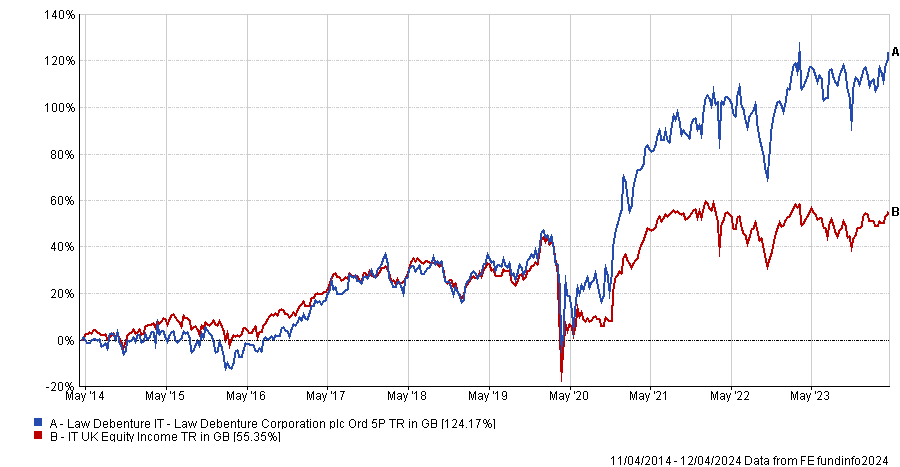
Source: FE Analytics
At £1.1bn, it is one of the largest trusts in the sector and the equity portion of the portfolio is managed by FE fundinfo Alpha Manager James Henderson and Laura Foll.
They have a “contrarian, value-focused investment style” and have propelled the trust to the top of the sector over five and 10 years – making 124.2% over the decade.
“For the past 10 years the IPS business has contributed 34% of Law Debenbture’s revenues and, given the recurring nature of this income stream, this provides the scope for the equity portfolio to be invested unconstrained by yield criteria,” the analysts sad. “This is a significant competitive advantage for a trust operating in the UK Equity Income sector.”
For investors looking to take on more risk, UK mid- and small-caps have been hit harder than the FTSE 100 and are even more out of favour than their large-cap peers. If sentiment is changing, there could be a more rapid rebound in this area of the market.
One such name that could benefit from the UK becoming more popular is Aberforth Smaller Companies, a value strategy.
“The trust has a strong track record, including through years of growth outperformance. Since inception in 1990, it has delivered an annualised NAV total return of 11.4%, 1.8 percentage points higher than the Numis Smaller companies (ex-Investment Companies) index per annum,” the analysts said.
It focuses on the smallest companies in the UK markets where the discount to global markets is particularly stark, with the underlying price-to-earnings (P/E) ratio of the trust’s holdings at just 6.9x, which is a “near record low”.
“Historical evidence suggests that it should support a future five-year annualised return of more than 20%,” the analysts forecast.
Despite their low valuations, just 20% of the stocks in the portfolio have net debt to earnings before interest, tax, depreciation and amortisation of more than 2x – suggesting the majority have strong balance sheets.
“The value in UK small caps is beginning to be recognised and M&A has been a key source of recent returns for Aberforth Smaller Companies,” the analysts noted.
Current valuations give investors a good entry point, they argued, with the current discount of 13% slightly above its 12-month average of 12%.
“As international and domestic buyers alike begin to realise the returns on offer at the small-cap end of the UK equity market, there could be scope for discount narrowing,” they concluded.
Following a major air attack against Israel, Mirabaud Group highlights the parts of the market that might react to continued tensions between the two countries.
Oil, gold, cryptocurrencies and defence stocks are among a wide range of investments that could be affected by the aftermath of Iran’s “historic” attack on Israel, Mirabaud Group has warned.
Iran launched a major air attack against Israel late on Saturday, after it fired several hundred drones and missiles at the country and the territory it controls. This was the first direct attack of this kind launched from Iranian territory after decades of shadow warfare between the two nations.
There were no fatalities in the attack, which was in response to a recent strike on a building in the Iranian embassy complex in Syria (it is believed to have been carried out by Israel, although the country has a policy of not confirming or denying its involvement in such incidents). However, 12 people were taken to hospital and the Nevatim air base, located in the Negev desert in southern Israel, was reportedly slightly damaged.
John Plassard, a senior investment specialist at Mirabaud Group, said: “Tensions have soared in the region following six months of brutal warfare between Israel and Hamas, the Palestinian militant group backed (unofficially) by Iran, triggered by the latter’s attacks on 7 October last year. Rear admiral Daniel Hagari of the Israel Defence Forces (IDF) described Saturday's barrage as a ‘major escalation’.
“Iran, a long-standing enemy of Israel, has always used proxies to carry out its interventions, hence the interest in groups allied to it in the Middle East. This time the situation is different, because it's historic.”
In light of this, Plassard highlighted several areas of the market that investors should pay close attention to in the wake of the attack, starting with the oil price.
Iran's control over the Strait of Hormuz, a crucial route for oil transportation, places it in a strategic position that can influence global oil supplies. This control became evident as oil prices surged on Friday due to rumours of potential military actions, although they later subsided slightly. Despite this, the general trend for oil prices is expected to continue rising.
Other commodities might also fluctuate depending on their regional ties and the evolving geopolitical situation. Continued tensions could lead to increased volatility in these markets.
Gold, often seen as a stable investment during times of uncertainty, has responded to the recent tension in the Middle East. The yellow metal hit a new all-time high last Friday and could rise further if the conflict intensifies.
Meanwhile, the cryptocurrency market reacted negatively to Iran's recent attack on Israel. Bitcoin, for example, dropped from around $67,000 to $61,625, erasing over $130m in market capitalisation shortly after the event, underscoring the volatile nature of cryptocurrencies during geopolitical crises.
In the defence and aerospace sectors, stocks may gain as investor interest grows, fuelled by Israel's effective defence measures against the Iranian attack. Confidence in Israel’s military capabilities could enhance the appeal of stocks related to defence technologies.
Currency values are sensitive to international conflicts, potentially affecting the exchange rates of those directly involved in or connected to the region. Typically, safe-haven currencies such as the Swiss franc and the US dollar would experience gains in such scenarios.
Stock markets in the Middle East are particularly susceptible to shifts in geopolitical dynamics, which could lead to increased volatility. Conversely, markets perceived as more defensive, such as Switzerland, might benefit from investors seeking safer assets.
Market volatility, which has been relatively “dead” since November 2023, showed signs of resurgence following the weekend's events. The VIX, known as ‘the fear index’, exceeded 17 for the first time since the previous October, indicating market volatility could escalate if the conflict continues.
Finally, Plassard said investors might demand a higher risk premium for all assets in the region on the back of this geopolitical uncertainty and tensions. “In short, in the event of Iran's involvement (or continued involvement), many assets could be affected,” he argued.
QuotedData weighs up the relative merits of AVI Japan Opportunity and JPMorgan Japanese for investors seeking exposure to Japan’s improving corporate governance and rising stock market.
The Nikkei 225, one of the flagship indices used to measure the performance of the Japanese market, hit a new all-time high in February and has carried on climbing since. That is a big deal because the previous high was set in 1989 and was followed by a prolonged and deep slump.
There have been many false dawns since, but the cumulative effect of far-reaching corporate governance reforms and more favourable economic conditions finally seems to be feeding through into Japanese equity markets.
The market’s tale can be told by following the fortunes of two very different funds focused on the country. With a market cap of £780m, JPMorgan Japanese is the largest investment company specialising in Japan. The trust has been managed since 2010 by Nicholas Weindling and, for many years, he has been assisted in this by Miyako Urabe.
Their management style is to identify fast-growing companies that can thrive by opening up new markets or by taking market share from incumbents. Such businesses are relatively rare, but once the managers have found great companies, they back them for the long term and so portfolio turnover tends to be quite low as a result.
The point here is that they place little or no reliance on economic growth within Japan, which is held back by a shrinking workforce and ageing population.
The JPMorgan Japanese approach does seem to work over the long run (all four Japanese large-cap trusts have very similar returns over 10 years), and we only have to go back to 2020 to find a period when it was by far the best-performing of all Japanese trusts. However, in retrospect, valuations were probably overstretched.
Like most other growth-focused funds, it had a difficult period over the first few months of 2022, a period that coincided with sharply rising interest rates in the US (which more recently look to have peaked but have not yet started to fall).
For many years, the Japanese authorities have sought ways to encourage growth. Just over a decade ago, a new Prime Minister, Shinzo Abe ushered in an environment of ‘easy money’, government stimulus, and crucially structural reform, that has expanded into a comprehensive shake-up of corporate governance.
On the ‘easy money’ front, very low interest rates were a core part of that. This has put downward pressure on the Japanese yen, which in turn makes the returns that Japanese funds have generated look worse than they otherwise would do.
Despite having low interest rates, for a long time a backdrop of deflation encouraged investors (and many companies) to hoard cash. Many companies built up cross-shareholdings too. However, these unproductive parts of balance sheets tended to be discounted by investors and many companies ended up trading at less than the value of this cash and unnecessary investments.
The majority of the 4,000 or so listed Japanese companies have no analyst coverage and are not particularly investor-friendly. That enabled some pronounced value opportunities to emerge.
Over time, efforts to improve corporate governance have strengthened and this is having a material impact on Japan’s stock market.
One of the drivers of this has been the Tokyo Stock Exchange; last March it asked companies with a price/book ratio of less than one to explain how they were going to tackle this, for example. Cross-shareholdings are being unwound, dividend pay-out ratios are rising, and share buy backs are proliferating. Nevertheless, some companies are still dragging their feet.
As corporate governance reforms started to bite, funds were launched to take advantage of the many bargains on offer. In the investment company market, a pioneer in this area was AVI Japan Opportunity, which was launched in October 2018.
This £184m market cap trust was the brainchild of the team behind AVI Global Trust, which had already had some success targeting undervalued Japanese companies. That success has continued with AVI Japan Opportunity, which since launch is amongst the best-performing of all Japanese-focused investment companies.
AVI Japan Opportunity estimates that there are about 470 companies that have net cash and securities greater than 30% of their market cap. Its managers have constructed detailed models on approximately 60 companies.
Once it has built a stake (big enough to be influential but it is not seeking control), the team will approach the company with ideas of how it can unlock value. This often involves streamlining the balance sheet but sometimes the team has suggestions about improving business efficiency too. These approaches take place behind closed doors, but if target companies prove intransigent, AVI may go public with its proposals and put forward resolutions at company meetings.
In these situations, AVI Japan Opportunity needs to be patient, but the rewards for success – which often flow through to all stakeholders – can be significant. Hence returns tend to be lumpy.
International investors have been encouraged by the commitment to reform in the country. There are signs of positive change in the economy too. Inflation has returned and wages are rising in some sectors. Domestic investors are taking more of an interest in equities but for these funds, a real boost could be a strengthening yen.
James Carthew is head of investment companies at QuotedData. The views expressed above should not be taken as investment advice.
The Finsbury Growth & Income Trust manager has had a poor start to the year, but says there were pockets of positivity.
It has been a disappointing start to the year for investors in the Finsbury Growth & Income Trust and WS Lindsell Train UK Equity fund, which have made a loss of 2.4% and 2.5% respectively so far in 2023.
Yet FE fundinfo Alpha Manager Nick Train believes there were positives as well as negatives for his quality-growth strategy between January and March.
What didn’t work in the first quarter was luxury, particularly companies exposed to the Chinese consumer, he said in the trust’s latest monthly factsheet.
Performance of fund and trust vs sectors and benchmark over YTD

Source: FE Analytics
“Our worst performers were Burberry and Remy Cointreau, both down well over 10%, both with important franchises in Asia and greater China,” he said. “It is frustrating to note that the two are now trading at below half the peak share prices they set in 2023 (Burberry) and 2022 (Remy).”
China has been a contentious area of the market since Covid as the country emerged from lockdown much later than most of the rest of the world. It has also suffered myriad issues surrounding its property sector as well concerns over government intervention in areas such as tech.
However, of more concern to luxury companies is the trend of Chinese consumers preferring domestic products to foreign goods – a change that has taken place since in recent years.
“What has undermined them [Burberry and Remy] has been justified concerns about weakening Chinese demand for western luxury products,” said Train, although he noted that “we must hope these big share price falls have created future opportunity”.
“We know both companies continue to invest behind their brands in the region and that one day growth and consumer confidence in Asia will recover.”
Diageo has also been a poor performer over the quarter. Last week Liontrust’s Anthony Cross said the “jury was still out” on the company after stocking problems in Latin America led to a profit warning.
Train said Diageo’s premium spirits portfolio marginally underperformed during the quarter, with a gain of 3.5%, but noted that the firm was able to reassure investors that its problems in Latin America are easing. “Many, including us, now hope for an improvement in its sales performance elsewhere,” he said.
Asset managers also struggled in the first quarter, with Schroders down 9% and Rathbones also trailing.
“We understand the reasons the industry is out of favour, but believe the companies we hold have differentiated and winning strategies and, as a result, their share prices have become undervalued,” said Train.
“For instance, Schroders has a clearly-articulated and patiently executed strategy to shift its business mix to higher growth and higher margin segments, such as private wealth and private equity, and the strategy is clearly working. If the company can deliver even a smidgen of secular growth then that rating and share price could change meaningfully for the better.”
It was not all doom and gloom however. Tech continued to do well, which the Finsbury Growth & Income Trust has access to through UK-listed data and software companies such as RELX (up 10.1%), Experian (8.4%) and Sage (9.1%).
Performance of stocks in Q1 2024

Source: FE Analytics
Train said: “A smart shareholder asked me recently – which of your holdings really has the potential to double or treble profits over the next decade or more and, as a result, become a much bigger market capitalised company and higher share price?
“My answer was that we believe in all our companies – you have to be a true long-term investor. But that amongst the large-cap holdings in the fund, it is readily conceivable that RELX and Sage have transformative profit potential ahead.”
Another in this sector, LSEG was up 2% in the quarter, underperforming the index, but “creeping back” toward its share price peak set in 2021. It is now 4% adrift.
“We hope that further business progress for LSEG and a likely final placing of the Refinitiv vendors’ stake will clear the way for new share price highs in due course,” he said.
There were idiosyncratic winners in the quarter too, such as tonic maker Fever-Tree, which was up 14% on the back of strong growth numbers in its year-end results. While Train noted the shares currently seem expensive, he said they “will look a bargain” if it can live up its potential.
Unilever was up 5% after announcing the sale or demerger of its ice-cream division, which he said “demonstrated the management’s ambition to highlight and realise the growth and value intrinsic in the group’s portfolio”.
The only meaningful change to the portfolio was Train continued to add to its newest holding Rightmove, taking its position to 3.5% of the net asset value (NAV).
“We have been able to build this position easily, because there are ready sellers at current prices. Those sellers are concerned that UK interest rates higher for longer will continue to retard the UK housing market and, in addition, that new competition may challenge Rightmove’s market share and profitability,” he said.
Last year was the lowest number of housing transactions in the UK (1 million) in a decade, but revenues were up 10% and Train noted the company is developing new products and services which “help its customers close more deals, more efficiently in a difficult market”.
Jupiter and Chelsea notably outperformed in the past five years.
Investors who don’t have the time or the drive to manage their own asset allocation, sometimes rely on mixed-asset managers to do that for them.
This doesn’t mean however that they can completely forget about their investments, and investors should always make the time to review their choice of fund and ensure they’re getting their money’s worth.
One way of doing that is through alpha, or the measure of outperformance against the fund’s own benchmark – the higher the alpha score, the more bang for your buck.
Below, we highlight the average alpha scores of the two Investment Association cautious mixed-assets sectors measured monthly since 2018 over 61 year-long periods. Outperformance is relative to the funds' own benchmarks – which for every fund below was the peer group.
For those who invest in the IA Mixed Investment 0-35% Shares funds, the best choice, with the highest average score of 1.88, was the Jupiter Merlin Conservative Select fund, which maintained a positive alpha in 60 of the 61 periods measured.
Jupiter’s fund-of-funds range took up many top positions in the other sectors as well, and according to Square Mile’s analysts, much of its longer-term success can be attributed to managers John ChatfeildRoberts and Algy SmithMaxwell, who have “adeptly blended an ability to navigate the broader economic environment with astute fund selection”.
Based around capital preservation, one of the key features of this fund is its conviction-led portfolio that is built without reference to the peer group benchmark.
“Overall, we hold this team in high regard and consider this a strong offering for investors seeking a product run by experienced and proven investors, with a strong long-term record of managing multiasset fund-of-funds portfolios who have successfully delivered on the fund's expected outcome since launch,” Square Mile’s analysts said.
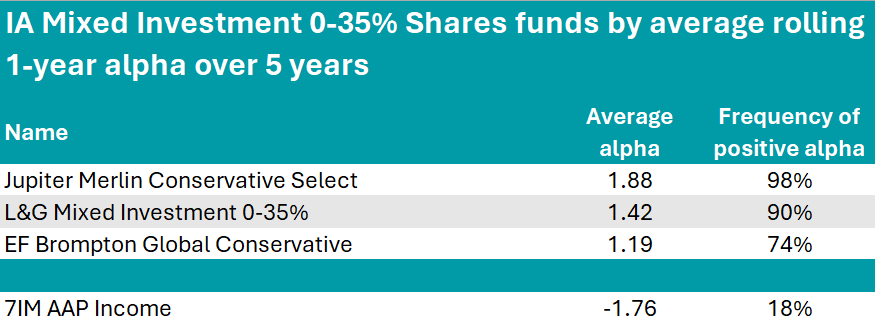
Source: FinXL
In second position, the L&G Mixed Investment 0-35% achieved an average alpha of 1.42 by investing in other L&G strategies with a 20-80% split between equities and bonds, of which 26% is developed government bonds, 29% developed corporate bonds and 14% high yield and emerging market debt. It is managed by Bruce White and Christopher Teschmacher.
At -1.76%, 7IM AAP Income had the lowest alpha – however, this passive range of strategies is highlighted by RSMR analysts for offering “consistency of process, return and volatility over the medium to longer term”.
The 7IM investment process focuses on finding value in both asset allocation and fund selection and places significant resource into the areas that they feel will produce the greatest levels of return.
The first fund to stand out in the IA Mixed Investment 20-60% Shares was VT Chelsea Managed Monthly Income, with its 3.36 of average alpha.
With £57.8m of assets under management, it is a small fund but stands out for its performance, achieving an FE fundinfo Crown rating of five.
It has a target weighting of between 40% and 60% in UK and overseas equities, although it under this at present (30%). Within its equities bucket, the fund has 42% invested in the UK, 23% in Europe and 18% in the US.
Alongside equities and fixed interest (31%), the fund also invests in alternatives (20%), including aircraft leasing, property (12%) and target absolute return strategies (3%).
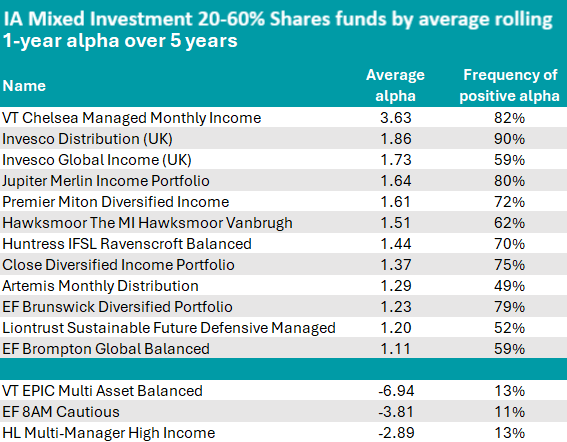
Source: FinXL
Taking up the second and third position are two Invesco strategies: Invesco Distribution and Invesco Global Income.
The former is an absolute return strategy that outperformed the peer group in 90% of the periods measured and is rated by RMSR analysts for its “high-quality team in both fixed interest and equites, lower volatility and proven track record”.
“The process brings together two of Invesco’s strongest teams [equity and fixed interest] in what is a relatively conservative fund, its balance dictated by the fixed interest element,” they said.
“We would consider this as a good first step into the equity market for income seekers without increasing the risk of a portfolio by a significant amount.”
Also of note were the Premier Miton Diversified Income and Hawksmoor The MI Hawksmoor Vanbrugh portfolios.
The lowest scores were those of VT EPIC Multi Asset Balanced (-6.94), EF 8AM Cautious (-3.81) and HL Multi-Manager High Income (-2.89).
IA sectors previously in this series: UK Equity Income, UK All Companies, Global, Global Equity Income, Sterling bonds, smaller companies, global bonds.
Trustnet looks at funds within the IA UK Smaller Companies sector that have been managed by the same manager since 2004 or earlier and have achieved top-quartile returns over the past three years.
Small-cap investing is where active managers should (in theory) shine. With fewer analysts covering stocks lower down the market capitalisation, savvy investors have more chance of finding hidden gems.
Those who have been in the industry a long time could have a leg up on their younger rivals, having been through many market cycles and seen all sorts of events in their careers.
As such, below, Trustnet looks at the three funds managed by the same person since at least 2004 that have produced top-quartile returns over the past three years – showing they remain at the top of their game.
One of them is Aberforth UK Small Companies, which has been managed by Euan Macdonald since 2001, but who has since been joined by Peter Shaw in 2016, Jeremy Hall in 2018, Sam Ford in 2019, Rob Scott Moncrieff in 2022 and Rowan Marron last year.
Performance of fund over 3yrs and 10yrs vs sector and benchmark
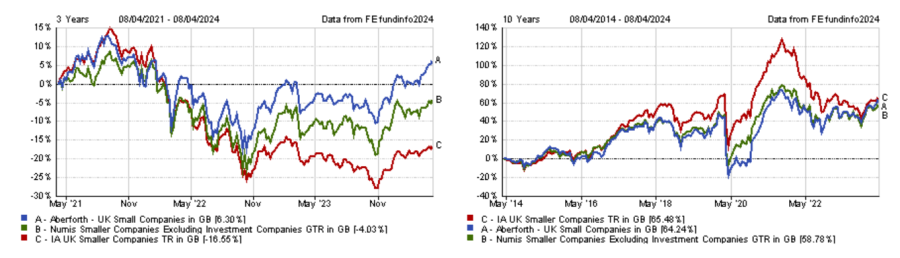
Source: FE Analytics
The fund is known for its value approach, with Macdonald and his colleagues looking for UK small-caps trading below their intrinsic value. As a result, the fund has benefited from the rotation to value in recent years.
M&A activities have also been a tailwind for the fund, as private equity firms and US companies have taken advantage of the low valuations within the small- and mid-cap segment of the UK equity market.
However, Aberforth UK Small Companies sits in the sector’s third quartile over 10 years, as the value style of investment has been out of favour for most of the past decade.
Moreover, the fund may not be for the fainthearted, as it has been the most volatile portfolio in the sector over the same timeframe.
Another UK small-cap fund managed by a veteran manager that has made top-quartile returns over three years is JPM UK Smaller Companies.
Georgina Brittain has been at the helm of this fund since 2000 and was joined by Katen Patel in 2015.
Performance of fund over 3yrs and 10yrs vs sector and benchmark
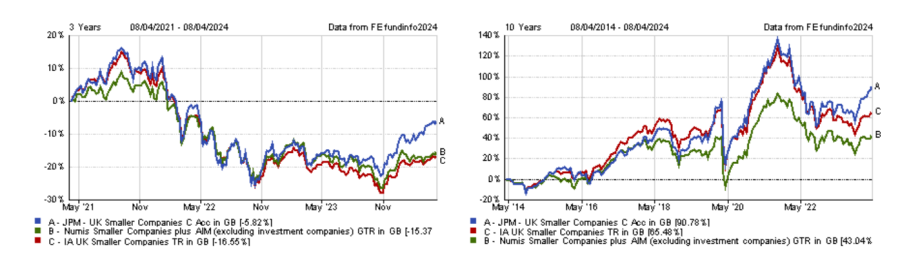
Source: FE Analytics
Unlike Aberforth UK Small Companies, the fund has lost money over three years, but to a much lesser extent than most of its competitors, explaining its presence among the sector’s top quartile performers during this time.
The past three years have been challenging for UK smaller companies, as the sector is down 16.6%, suffering from higher inflation and interest rates, as well as being part of an unloved market.
A further argument is that UK equities have been left without natural buyers and thus no valuation support, as British pension funds have favoured global equities since they are not required to hold any specific allocation to domestic equities.
The long-term performance of JPM UK Smaller Companies longer-term performance has been strong nonetheless, as the fund also sits in the top quartile over five and 10 years.
It has been one of the most volatile funds in recent years but has delivered some of the best risk-adjusted returns, with the fund’s Sharpe and information ratios both in the sector’s top 10.
Finally, Catherine Stanley, manager of the CT UK Smaller Cap Fund, is the last of the veteran managers of UK funds to have delivered top-quartile returns over three years.
Performance of fund over 3yrs and 10yrs vs sector and benchmark
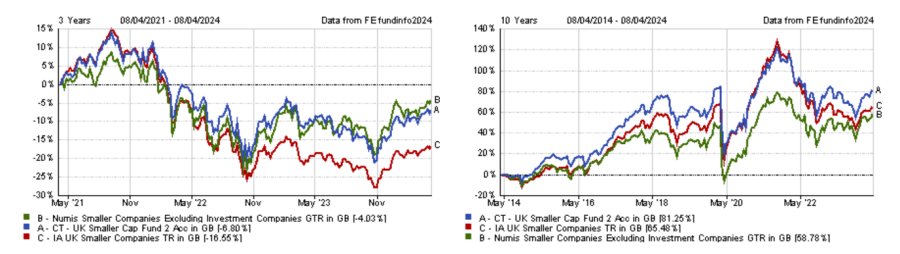
Source: FE Analytics
Stanley has been managing the fund since 2004 and was joined by Patrick Newens in 2019. They are growth investors, looking for UK small-caps exhibiting above average growth rates or good growth potential.
Just as the JPM fund, CT UK Smaller Cap Fund has made a loss over three years, but is still the 11th best performer over the period.
Over the long term, performance has been good as the fund has delivered second-quartile returns over 10 and 15 years, but it has rarely sat in the sector’s top quartile.
Yet, the fund has been one of the least volatile in the sector and has had one of the lowest drawdown – price drops from peak to through – over the past decade. This has also been true over the past three years.
Previously we looked at the IA UK All Companies sector, where there was only one veteran manager to achieve the feat.
The Liontrust UK Growth fund is on the hunt for businesses with intangible assets such as intellectual property that competitors can’t copy.
People adopting a healthy lifestyle by drinking and smoking less is arguably a good thing but it put a dent in the Liontrust UK Growth fund last year. Shares in British American Tobacco and Diageo fell 23% and 20%, respectively, in 2023 and cost the fund 1% of performance each.
Anthony Cross, head of the Economic Advantage team at Liontrust Asset Management, is keeping faith with Diageo. He looks for companies with intangible assets such as large-scale distribution networks that are hard to replicate and favours international consumer goods companies such as Diageo and Unilever. The big unknown for Diageo is how widespread the take-up of American diabetes and weight loss drugs will be, given that people who take these drugs consume less alcohol.
The fund’s strongest recent performers are companies that specialise in data and software tools. Sage, which provides accounting software and cloud-based services, was on a tear last year climbing 61%, while RELX, which supplies analytics and decision tools for the medical, legal and government sectors, rose 39%.
Cross manages the £1bn Liontrust UK Growth fund with Julian Fosh, Matt Tonge and Victoria Stevens. The large-cap iteration of the Economic Advantage investment process, it has achieved top-decile performance for the past decade, earning Cross and Fosh a nomination for FE fundinfo’s Alpha Manager of the Year award.
Cross told Trustnet why he doesn’t think he can add value by making macro calls and why intangible assets drive long-term returns.
What is the UK Growth fund’s investment process?
The process starts with the hunt for businesses that have strong barriers to competition through intangible assets. Three intangible assets are the gateway into any of our funds: intellectual property, distribution and high recurring revenues (more than 70% of a company’s income should be recurring).
Stocks must have at least one of these factors but several of our holdings have two or three. Sage is rich in intellectual property and data-driven distribution and more than 90% of its turnover is recurring income.
Once stocks are through the gateway, we look at other intangible assets such as brands, customer relationships, franchises, licences and culture, which are difficult for competitors to copy and give companies pricing power.
Our companies have an average 12% cash flow return on invested capital versus 7% for the broader market. It’s a really nice test for us as to whether those barriers to competition are actually working.
Finally, when we buy these businesses for the first time, they need to be cheaper than the market on a number of standard measures, such as free cash flow yield, dividend earnings and price-to-earnings ratios, to make sure we’re skewing the odds in our favour.
Why should investors buy the UK Growth fund?
This is the fund to own if you want large-cap exposure. The UK Growth fund has 70% in the FTSE 100, 20% in FTSE 250 stocks, 7% in small-caps and 3% in cash.
There are 44 positions in the portfolio. Most companies go in at 2% plus their index weight so some of our holdings can be quite big. We own 8% in Shell and AstraZeneca, 5-6% in BP and 4% in Diageo.
What you’re going to get with this fund is a quality footprint and compounding. It also has a nice international flavour if you’re a bit bearish about the UK, given that 82% of our companies’ sales come from overseas versus 76% for the FTSE All Share.
Performance of fund vs sector and benchmark over 10yrs
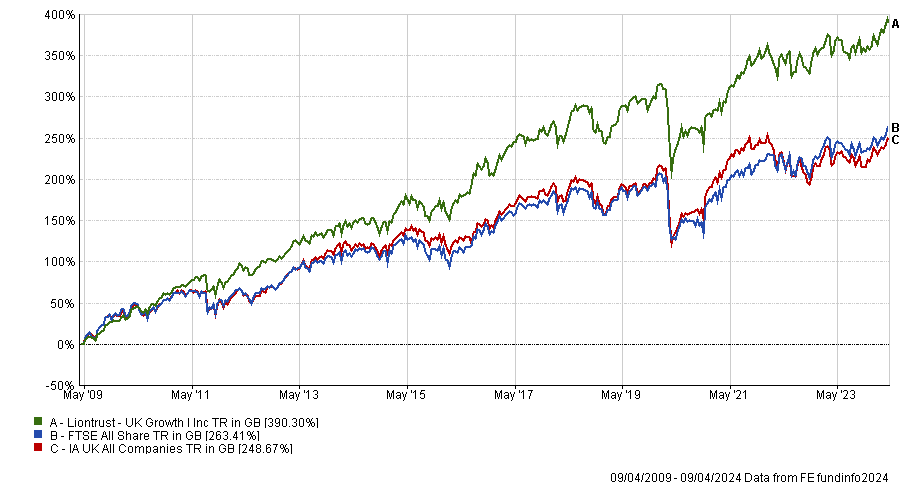
Source: FE Analytics
Which stocks were your best and worst performers last year?
Shell, Sage, BAE Systems and RELX each added 1% of performance to the fund last year. With RELX and Sage, not only were they delivering on earnings but you’ve got that general data excitement going on, so they enjoyed an increase in their price to earnings ratios.
Performance of shares vs FTSE 100 in 2023
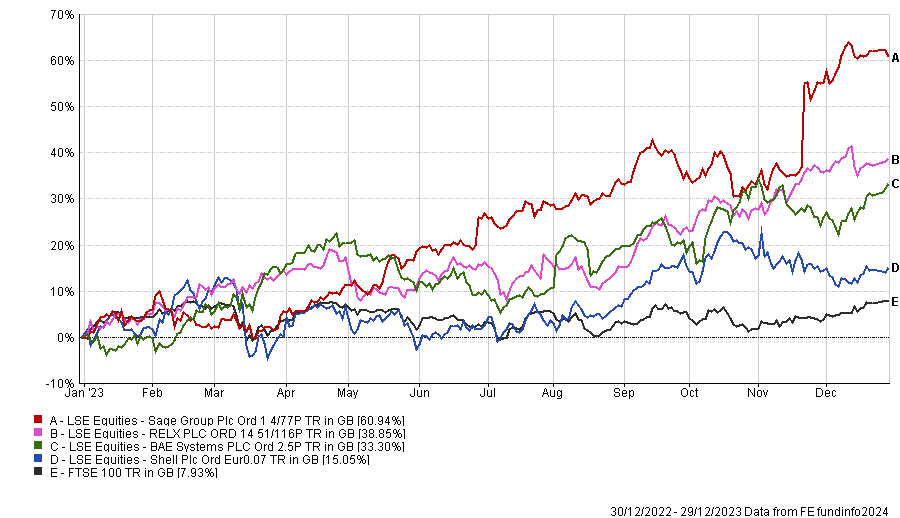
Source: FE Analytics
We bought Sage five years ago on a free cash flow yield that was larger than the market. Everyone had given up on Sage at that point; people thought its customers would move to competitors.
Sage has a strong base of clients using its accounting software who are unlikely to change providers. We thought the stickiness of its distribution network would enable the company to migrate to more cloud-based products, which is what happened. Sage is delivering high-single-digit to double-digit organic growth. If growth slows down it could underperform so we have taken profits and trimmed our exposure.
In terms of detractors, British American Tobacco and Diageo each cost us 1% in 2023. The jury is still out with Diageo. It performed well during the successive lockdowns but since then people are drinking less and there has been a cost-of-living crisis.
Diageo also had a stocking problem in Latin America, where the wholesale market was overstocked and demand was not pulling through. This led to a profit warning with a brand new set of management.
Invidior cost us 0.8% last year but it has performed strongly this year, adding 0.5% to the fund already. Invidior had some dangling liabilities and litigation issues which were biting last year and it faced pressure from competitors, but this year the business has performed well and it has dealt with the litigation.
Invidior vs FTSE 100 since 1 Jan 2023
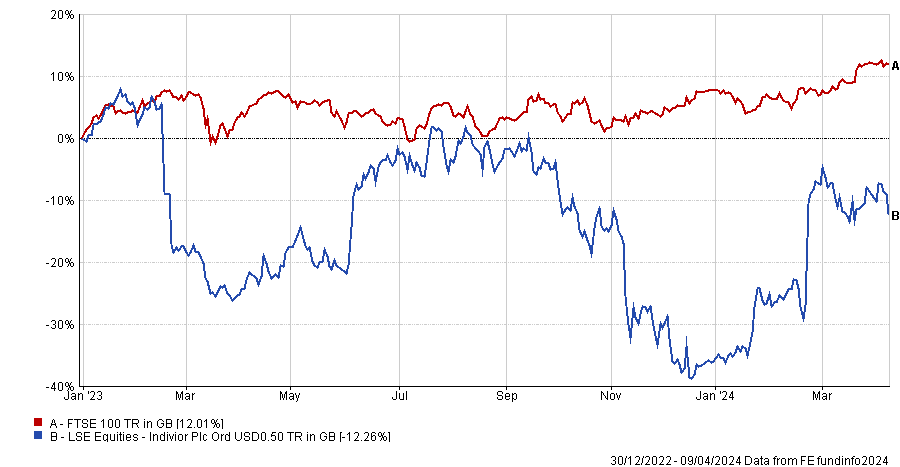
Source: FE Analytics
What are your highest conviction investments?
We have most conviction in some of the small-cap stocks from a valuation perspective. Gamma Communications provides phones and conference call systems to small and medium-sized businesses. It has gained some larger enterprise and government clients and is expanding into Europe, which is quite underdeveloped when it comes to cloud-based telephone systems.
Market research provider YouGov has faced a tough backdrop with declining media spend but it has a strong brand and terrific data sets and could grow a lot more in America.
Future, a mid-cap digital publishing business, is trading on a price-to-earnings ratio of 5x and has a double-digit free cash flow yield. Its magazines, from Country Life to TechRadar, earned revenues from affiliate marketing during lockdown, but since the pandemic, purchasing habits have changed and revenues have dropped.
How much attention do you pay to the broader macroeconomic backdrop?
We don’t attempt to predict where inflation, interest rates or foreign exchange are travelling because we don’t think we could add any value doing that.
Our companies themselves are always thinking about interest rates, currency movements and political upheavals in the countries they are supplying. One has to rely on businesses themselves doing their homework in terms of where they want to be exposed and what the dangers are.
What do you do outside of fund management?
I live near Perth in Scotland and I have a cottage further north. I’m a big believer in having a hinterland to put things back into perspective so I go fishing, which is a head-clearer and I enjoy skiing.
The information contained within this website is provided by Web Financial Group, a parent company of Digital Look Ltd. unless otherwise stated. The information is not intended to be advice or a recommendation to buy, sell or hold any of the shares, companies or investment vehicles mentioned, nor is it information meant to be a research recommendation.
This is a solution powered by Digital Look Ltd incorporating their prices, data, news, charts, fundamentals and investor tools on this site. Terms & Conditions. Prices and trades are provided by Web Financial Group and are delayed by at least 15 minutes.
© 2024 Refinitiv, an LSEG business. All rights reserved.
 Please wait...
Barclays Investment Solutions Limited provides wealth and investment products and services (including the Smart Investor investment services) and is authorised and regulated by the Financial Conduct Authority and is a member of the London Stock Exchange and NEX. Registered in England. Registered No. 2752982. Registered Office: 1 Churchill Place, London E14 5HP.
Barclays Bank UK PLC provides banking services to its customers and is authorised by the Prudential Regulation Authority and regulated by the Financial Conduct Authority and the Prudential Regulation Authority (Financial Services Register No. 759676). Registered in England. Registered No. 9740322. Registered Office: 1 Churchill Place, London E14 5HP.