Investors have done incredibly well over the past 15 years by simply holding cheap passive trackers, but returns for the next decade and a half appear far less certain.
Despite bouts of volatility, the past 15 years have generally been favourable for asset prices. For much of this time, both equity and bond markets have delivered strong returns for investors, helped by a tailwind of supportive monetary policy from central banks. That has meant that owning ‘the market’ has generally been a winning investment strategy, and it came with the bonus that it was typically a cheap one at that.
To put this into perspective, an MSCI All Country World Index (ACWI) exchange-traded fund (ETF) is likely to have delivered around 14% annualised in sterling terms since the low of the global financial crisis in March 2009. That’s well above the long-term average return of global equities.
A balanced investor would also have done well by owning the market – for example, a 60/40 portfolio (60% MSCI ACWI exposure and 40% Bloomberg Global Aggregate Bond exposure) would have delivered something like 10% annualised in sterling terms.
Investors could essentially ‘set and forget’ their asset allocation over this period and experience strong returns at low cost; what’s not to like?
I would argue that the next 15 years are unlikely to be like the past decade and a half for financial markets. And there are several reasons why.
A more challenging return environment ahead?
Firstly, the high valuations of global equities today are likely to be a headwind to future returns. In the short-term, valuation isn’t necessarily a great predictor of future returns, but over the long-term, it is a very powerful one. High starting valuations do not tend to augur well for future returns. In other words, the 14% annualised return experienced by global equity investors over the past 15 years is unlikely to be repeated.
What can we expect instead? It is of course a fool’s errand to try to predict what specific returns will be, but we can get an idea of potential magnitude. For instance, Invesco’s capital market assumptions (CMAs) indicate a much lower annualised return for global equities (MSCI ACWI) of around 6% annualised over the coming years. If this turns out to be even close to correct, then it is fair to question whether owning ‘the market’ will deliver enough for investors.
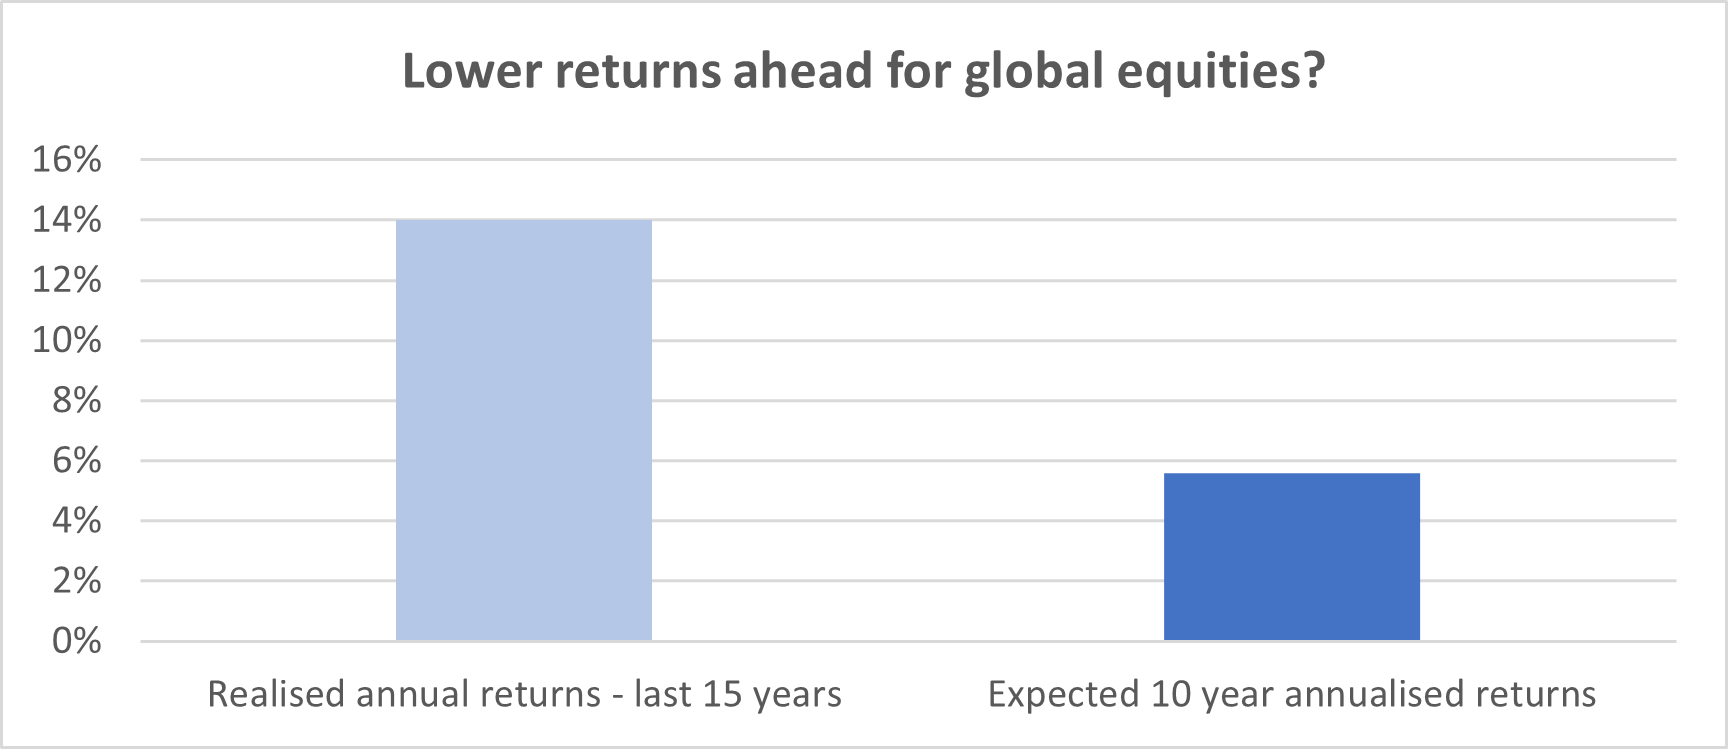
Sources: Bloomberg and Invesco. Realised returns – past 15 years are total annualised returns in sterling terms for MSCI ACWI as at 30 Apr 2024. Expected 10-year annualised returns are nominal return estimates based on Invesco’s 10-year capital market assumptions.
How diversified is the market?
Second, markets have in some cases become more concentrated and skewed over the past 15 years. US equities are a glaring example of this and they are a big part of the reason that the overall market looks expensive.
When I joined Invesco in early 2012, US equities made up around 43% of MSCI ACWI and around 50% of MSCI World, the former being the ‘all countries’ index and the latter being ‘developed countries’ only.
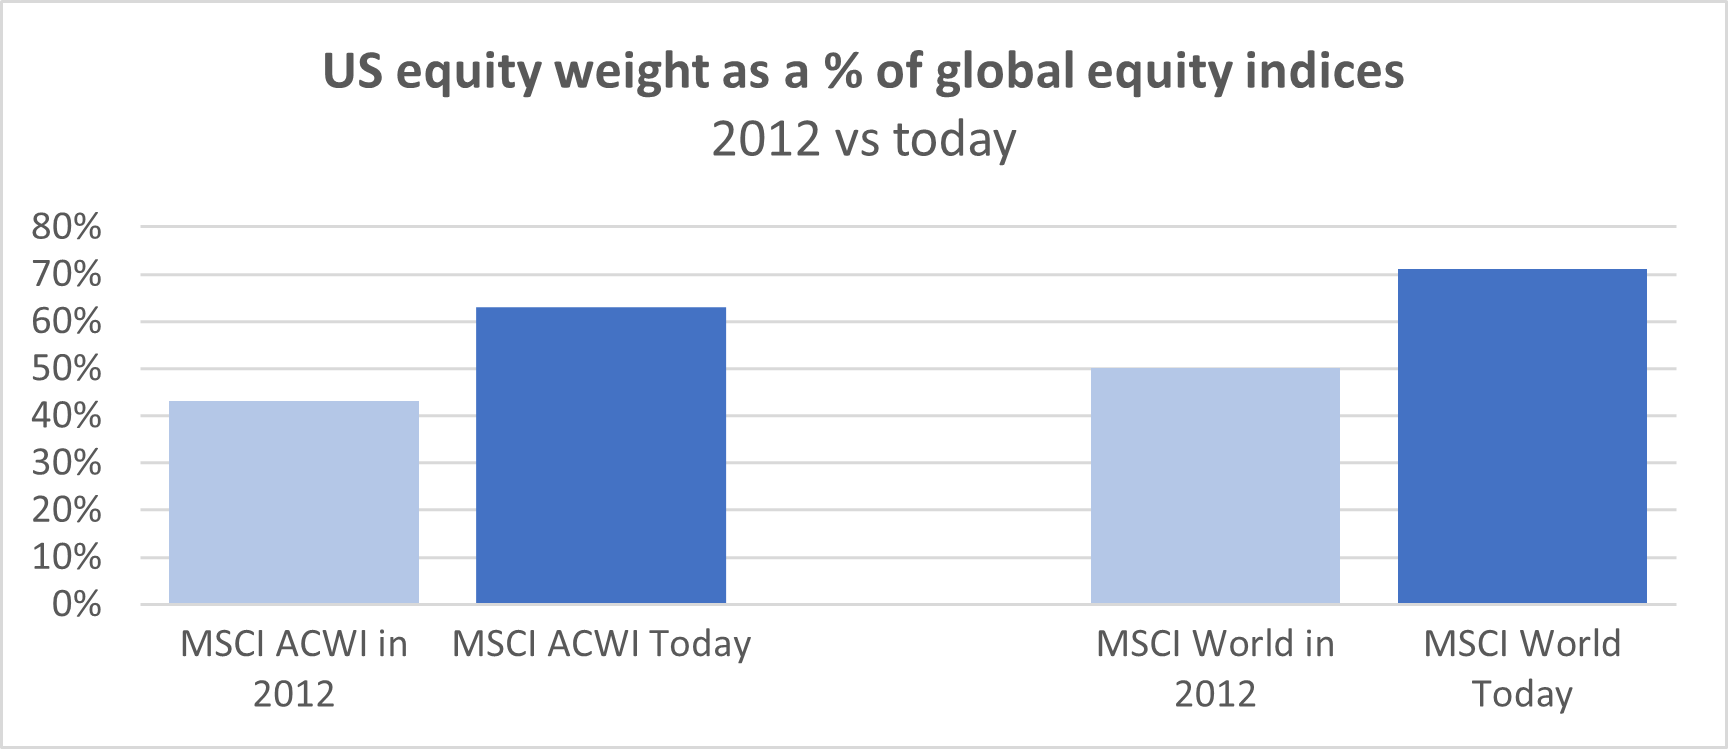
Source: MSCI as at 30 Apr 2024
Today, US equities account for around 63% and 71% respectively. Essentially around two-thirds of global equity exposure is US exposure. That is a lot of reliance on one market, especially one which is trading at what appear to be lofty valuations.
Currently, the US equity market’s 12 month forward price-to-earnings ratio is around 30% above its longer-term average.
While it may seem that the US has always outperformed, it’s worth remembering that this isn’t always the case. For example, in the first decade of the 2000s, US equities significantly underperformed the rest of the world, particularly emerging markets.
Japan is an interesting – albeit extreme – historical example of what can happen when markets become too prominent or concentrated. By 1989, Japanese equities had performed strongly and came to dominate the global market, accounting for around 40% of MSCI World. What followed was a multi-year period of underperformance and an exodus of investors. Today Japanese equities account for just 6% of MSCI World.
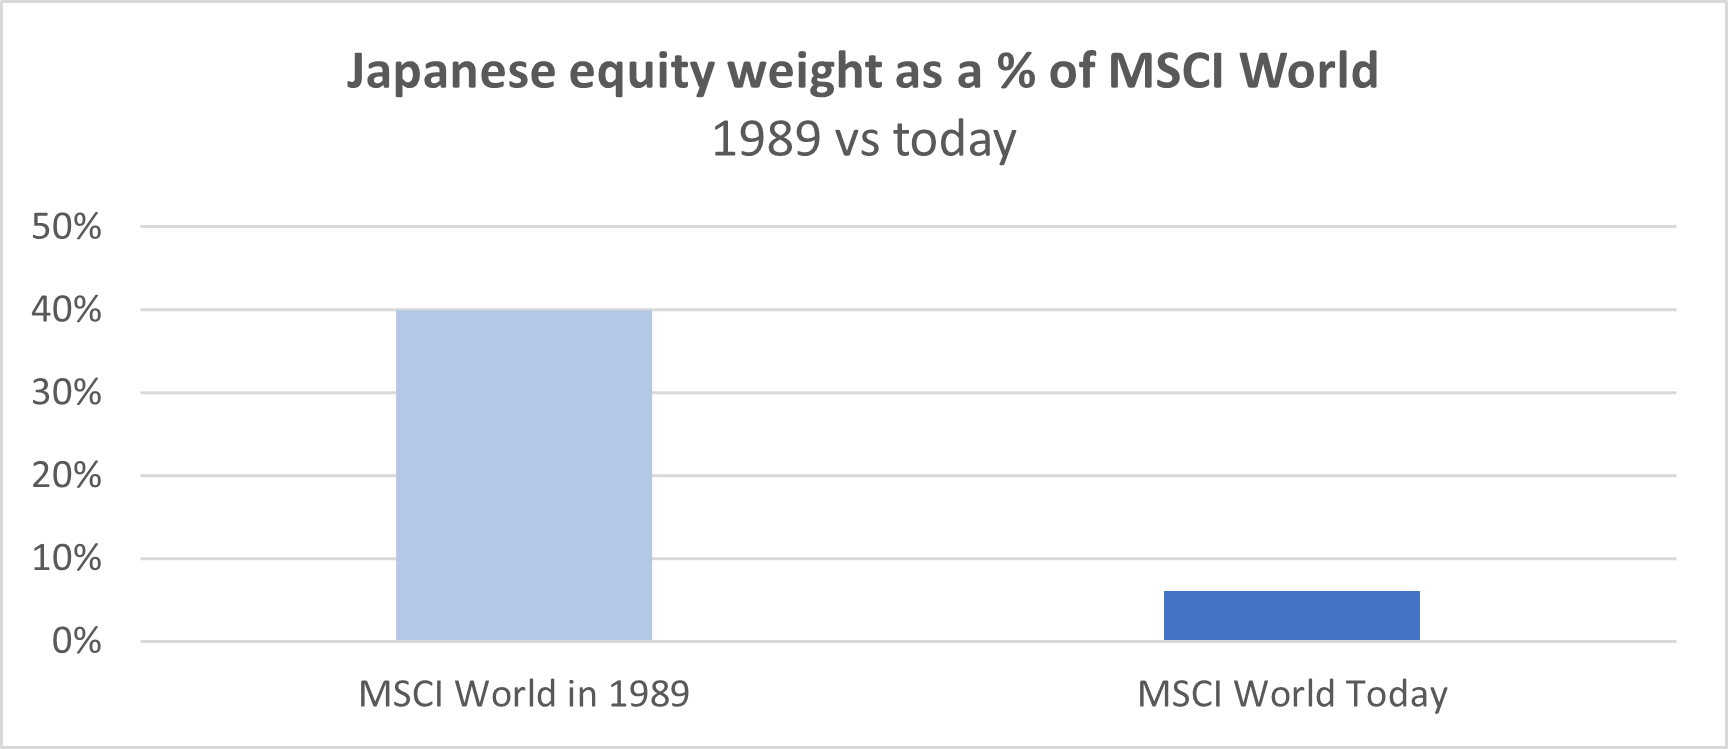
Source: MSCI as at 30 Apr 2024
A more challenging future means a more flexible approach
Given the risks of a more uncertain environment, lower market returns and a potential lack of diversification, what are investors to do?
I think a more flexible approach is a must. In my view, having two-thirds of the equity exposure of a ‘global’ portfolio in one single country is a significant risk. The ability to adjust asset allocation over time will therefore be an important tool in the investor’s toolkit in the coming years. As will the ability to change the underlying funds and ETFs they may invest in to ensure that no unintended biases are present in portfolios.
In short, take a more active approach, even if that is done by using passive underlying investments.
For those who would rather somebody else make those active asset allocation decisions on their behalf, the good news is that the cost of active management has reduced dramatically over the past 15 years. It is possible to access active asset allocation for relatively low cost. Over the next few years, I think that will prove to be a price worth paying.
David Aujla is a multi-asset strategies fund manager at Invesco. The views expressed above should not be taken as investment advice.
One global fund has been cutting back on its US tech exposure and adding to this UK company.
US dominance and the relative bottoming out of the UK market over the past decade may have left some global investors wondering whether there is a need to look to the domestic market at all.
Murmurs have begun about a potential poor run for the US, with Temple Bar manager Ian Lance telling Trustnet yesterday that investors should expect to make a loss from American stocks over the long term from here.
Chris Rossbach and Katerina Kosmopoulou, who are in charge of the $252.4m J. Stern & Co. World Stars Global Equity portfolio, are bullish still on the prospects of the US titans, recently stating that “we are in not a tech bubble of any kind”.
They have stuck with their exposure to digital through tough times before – most notably in 2000 – and did so again in 2021-2022 when they added to stocks such as Nvidia, the leading chip manufacturer. This has rewarded the managers, with the stock rising to be the top holding in the fund, making up 8.3% of the total assets under management (AUM).
Yet even they have begun to look elsewhere, trimming some of their tech allocation as they weigh up the continued strong growth from the US giants versus the prospects of better returns from elsewhere in the future.
Thanks to successful calls on these US names and the returns they have brought in, Kosmopoulou explained that the fund is now in a strong position to take some profit and allocate to other areas.
One such area has been the UK, where, however, only one business convinced the managing duo – spirits company Diageo.
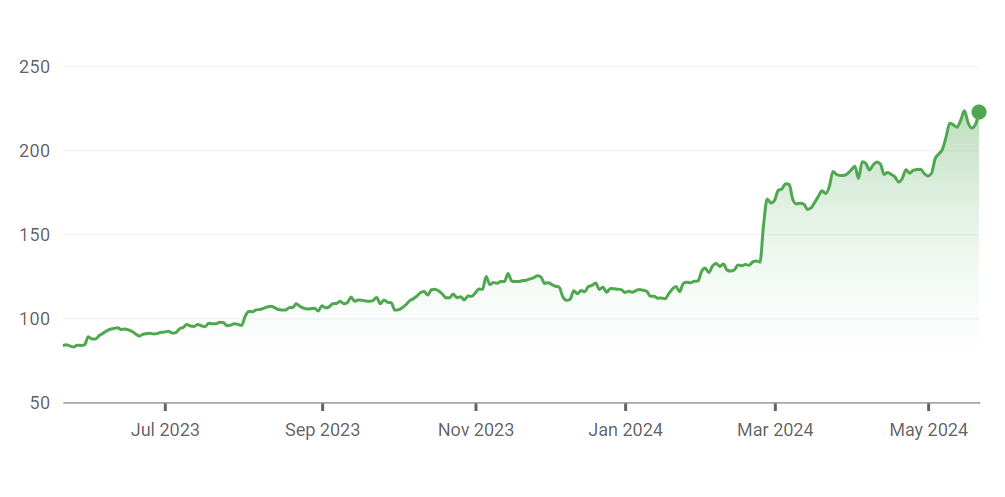
The company has been through a turbulent time in recent years, marked by a profit warning and its chief financial officer stepping down. Unsurprisingly, therefore, it has been a terrible performer of late, losing almost 20% over the past 12 months, 12% over the past three years and 6% over five months.
Performance of stock over 1yr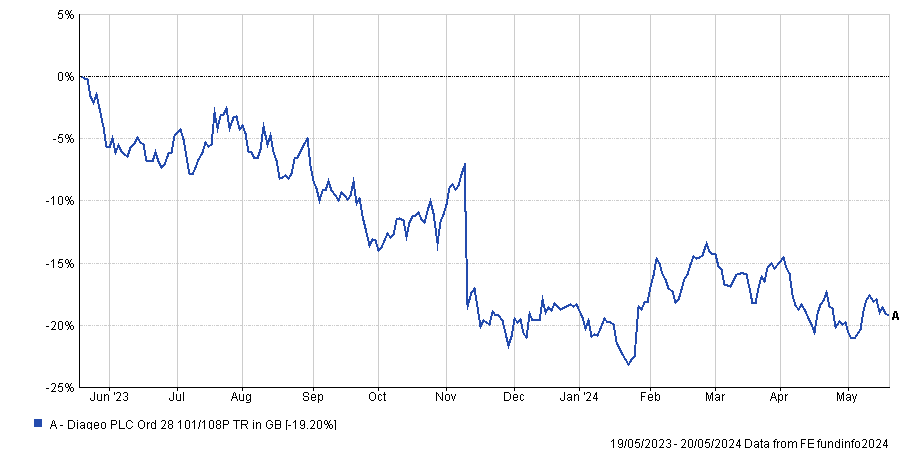
Source: FE Analytics
But the company is a good recovery play to Kosmopoulou, who said that Diageo is “a screaming buy”.
“Covid massively disrupted consumption and generated excess inventory throughout the supply chain. This is in the process of being corrected now, but the market hates that, so the stock is trading at more than 10% discount to its historical levels,” she said.
“Now if you could tell me that you and I will never drink again, I'm going to sell my Diageo position. But if you tell me that tonight we are likely to have a nice glass of whiskey, then to me that is that is basically a screaming buy.”
This is currently the only UK-listed company owned by the fund, Rossbach noted, with the overall country exposure adding up to 2% of the total AUM.
“We look at a global universe of companies, and the listing matters only in regards to the history of the company, the governance and the liquidity of its shares, with the UK being very strong on all of those points,” he said.
“There are a number of world-leading businesses that are here that we keep on analysing, especially in consumer products, healthcare and the intellectual property (IP) and payments-related areas of financial services, which we think are very interesting.”
Historically, Shell had been a holding in the J. Stern & Co. World Stars Global Equity fund. It was bought in 2012 at inception and sold later in 2014, when the managing team decided energy stocks weren’t for them. Since then, Diageo has been the only UK stock in the portfolio.
It is not alone in owning Diageo, with IFSL Evenlode Global Equity and Lindsell Train Global Equity among six funds in the IA Global sector also placing the stock in their respective top 10 holdings.
Nick Train also has a big position in the stock through his investment trust Finsbury Growth & Income. In the trust’s latest factsheet, the manager noted that it is “well-established” that the stock is out of favour and warned “it is still possible the next set of results will disappoint already low expectations”.
“Nonetheless, Diageo’s shares have now fallen over 30% from their peak in 2021 and we are sure it is right to be looking ahead to better trading for the company. In our view, Diageo shares will likely recover before those better conditions are confirmed,” he said.
Defined-contribution pensions will have access to L&G’s first private markets long-term asset fund from this summer.
The Financial Conduct Authority (FCA) has approved Legal & General’s first private markets long-term asset fund (LTAF). The regulator decided last week that L&G’s vehicle is suitable for defined-contribution (DC) pension funds, as per the FCA’s fund register.
The multi-asset fund will launch this summer and it will be able to invest in public and private markets, including less liquid industries such as infrastructure, real estate and private credit.
Jesal Mistry, head of DC investments at Legal & General called this “a significant milestone” which will provide over 5 million DC members with the opportunity to access illiquid investment opportunities.
“As the largest DC pension provider in the UK market, we have a real opportunity to use our scale and expertise to facilitate increased member access to private market,” he said.
“We designed a solution which meets the operational and liquidity needs of DC schemes, while providing additional return drivers and diversification benefits with the potential to further increase value for members.”
Further details on the strategy will be announced in due course.
The LTAF structure is designed to protect investors from liquidity issues and emergency exits, as they will be able to buy into or sell out of the fund at longer intervals than traditional open-ended funds, which deal daily.
L&G joins the list of providers with approved LTAF solutions so far, which includes Schroders, Aviva Investors, and BlackRock, among others.
Access to LTAF has also been approved for retail investors, with Nikhil Rathi, chief executive officer of the FCA, saying in March that the three umbrella funds and five sub funds currently authorised will be followed by “a strong pipeline and more expected shortly”, with the target assets under management after three years for LTAFs authorised to date nearly £6bn.
The consumer prices index hit its lowest since July 2021.
UK inflation dropped back to 2.3% in April, hovering just above the Bank of England’s 2% target, according to figures from the Office for National Statistics.
The main reason for the rapid drop in the consumer prices index (CPI) from the previous month’s 3.2% was falling energy costs on the back of Ofgem’s 12% reduction in the household bills cap, with the 27.1% fall in gas, electricity and other fuel prices being the largest on record.
It marks a sharp decline from the 11% inflation figures seen just two years ago, although the 2.3% figure is slightly above expectations, with 2.1% mooted by many, according to Isabel Albarran, investment officer at Close Brothers Asset Management. This was largely due to an upswing in motor fuel prices.
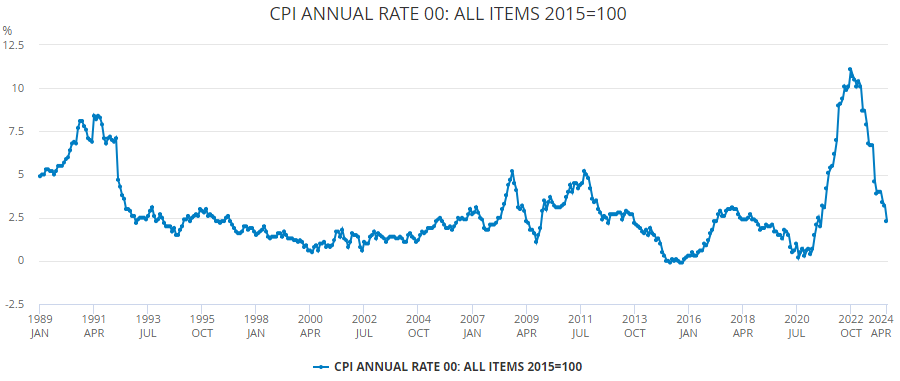
Source: The Office for National Statistics
Hetal Mehta, head of economic research at St. James’s Place, added that the monthly pace shows “significant inflation remains in the system”.
“Services inflation [unchanged at 6%] is still too rapid for comfort and higher energy prices in recent months are yet to fully feed in,” he said, while Zara Nokes, global market analyst at JP Morgan Asset Management, noted that this was “a lot hotter than its latest projections”.
Despite this it is still the closest we have been to the Bank of England’s 2% target since July 2021.
What will the Bank of England do now?
Nokes said the upside surprise in services inflation may “dent the Bank’s confidence that entrenched inflationary pressures are receding” making a June cut less likely.
“In our view a cut in June would be premature; if the economy were slowing we would expect core inflation to follow headline lower, but recent data has shown activity reaccelerating,” she said.
Quilter Investors investment strategist Lindsay James noted the biggest risk for the Bank will be further inflationary spikes in the second half of the year – something that could occur if wag growth (currently 6%) remains high.
“Pay deals and rises are going to come under intense scrutiny should that figure not begin to fall in line with the overall rate of inflation. Furthermore, the global picture shows no sign of helping the Bank of England in its task, with geopolitical risks still very much present and US inflation proving stickier than many would like,” she said.
Albarran suggested the Bank will wait until August for its first rate cut, with the latest CPI data going “some way in providing the evidence they need to justify an impending cut”.
Not all were as convinced. Mehta said: “For the Bank of England, the data is not conducive to a slam-dunk rate cut in the coming months – we expect there to be a continued split on the Monetary Policy Committee for a while.”
The impact on finances
Tom Stevenson, investment director for personal investing at Fidelity International, said mortgages are already pricing in lower interest rates with money markets giving a 40% chance of the first quarter-point cut in rates coming in June and a further reduction to 4.75% by the end of the year.
“For savers who have enjoyed ‘real’ inflation-adjusted returns on their cash for several months the good times may be time limited,” he said.
“Stock markets typically offer the best protection from low levels of inflation. At today’s rate, they have outpaced price growth in nine years out of 10 since the 1970s.”
Hawksmoor is bullish on the “astonishingly cheap” UK and expects returns of 10% per annum or more.
Hawksmoor Investment Management has placed a bold bet on the UK stock market, with its cautious Vanbrugh multi-asset fund having 20% in UK equities and the allocation rising to nearer 30% for the higher risk Global Opportunities portfolio.
Chief investment officer Ben Conway said UK equities are so cheap that they have a high probability of returning 10% or more per annum for the next decade, with even greater gains from mid and small-caps.
Valuations are Hawksmoor’s “north star” because, over five years and longer, they are a reliable indicator of returns, he explained. UK equities are “tremendously attractive from a valuation standpoint”.
The broad UK equity market is currently valued at 10x price to earnings. Historical data from Liberum dating back to 1927 shows that when valuations are below 10x, returns in the subsequent three to 10 years average about 14% per annum. From starting valuations of 10-15x, returns tend to be about 9-10% over the subsequent three to 10 years, Conway said.
Under-valuations are even more pronounced in UK small and mid-caps and therefore the return potential is commensurately greater.
UK equities have begun to rally, outperforming the S&P 500 over three months. Conway thinks the UK stock market is just getting started and said recent gains were driven by takeover activity, with cheap companies attracting attention from private equity and international trade buyers.
UK equities vs S&P 500 over 3 months
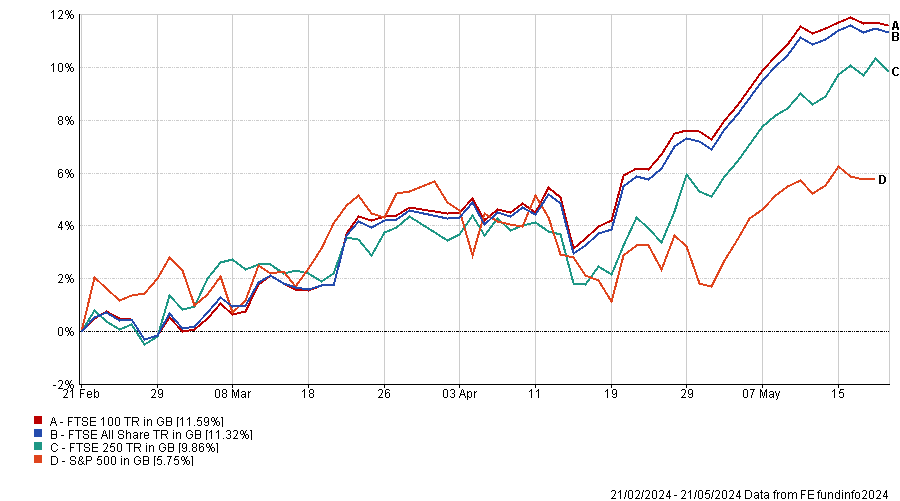
Source: FE Analytics
The UK stock market has been cheap for years but it recently entered the national conversation and is featuring in headlines and in politicians’ speeches, such as chancellor Jeremy Hunt’s Mansion House compact.
The chancellor’s request that pension funds disclose their UK equity allocations is the first step towards putting pressure on them to invest more in their home market, Conway said, “but there’s a fabulous investment reason to do so because it’s so cheap”.
Labour’s Financing Growth document, which sets out the party’s plans for the financial services industry, is “a UK equity fund manager’s dream”, he continued. It cites the undervaluation of the UK stock market and low levels of investment by pension funds in their home market as problems. It also states that vibrant capital markets are a necessary precondition for economic growth.
“UK equities are at the centre of policy to the extent that I don’t think they’ve ever been before,” he concluded, which is part of a “magic formula” driving the current rally.
Hawksmoor’s fund picks
For private investors who want to increase their exposure to the UK, Conway’s first suggestion would be a FTSE 250 tracker to capture a broad spectrum of opportunities in the mid-cap space.
Choosing active managers increases the odds of both outperforming and underperforming the market and requires an immense amount of research and monitoring, he said, hence passive investing may be more appropriate for retail investors if they do not possess the time or resources to research active managers.
For those who prefer active managers, Conway thinks investment companies are well-suited to retail investors because they have an independent board of directors looking out for shareholders’ interests who can hold the investment managers to account and replace them if a key person leaves.
He has high conviction in Aberforth Smaller Companies and Odyssean.
The Aberforth trust is managed by a long-established team of value investors based in Edinburgh and has a track record of accessing the cheapest parts of the small-cap universe, he said. Its largest holdings are publisher Wilmington and derivatives dealer CMC Markets.
Conway described Odyssean Capital’s Stuart Widdowson as a “wonderful investor” with an impressive five-year track record. He invests in high-quality, undervalued businesses, several of whom have received takeover bids. For instance, he holds XP Power, which has just rejected a bid from Advanced Energy Industries.
Performance of trusts vs sector over 5yrs
Source: FE Analytics
For large-cap exposure, FE fundinfo Alpha Manager Ed Legget, who runs Artemis UK Select, is “very talented”. The £2.2bn flagship fund has delivered top-quartile performance over one, three and five years and its largest holdings are Barclays, NatWest, 3i Group, Rolls-Royce and Shell.
Performance of fund vs sector and benchmark over 5yrs
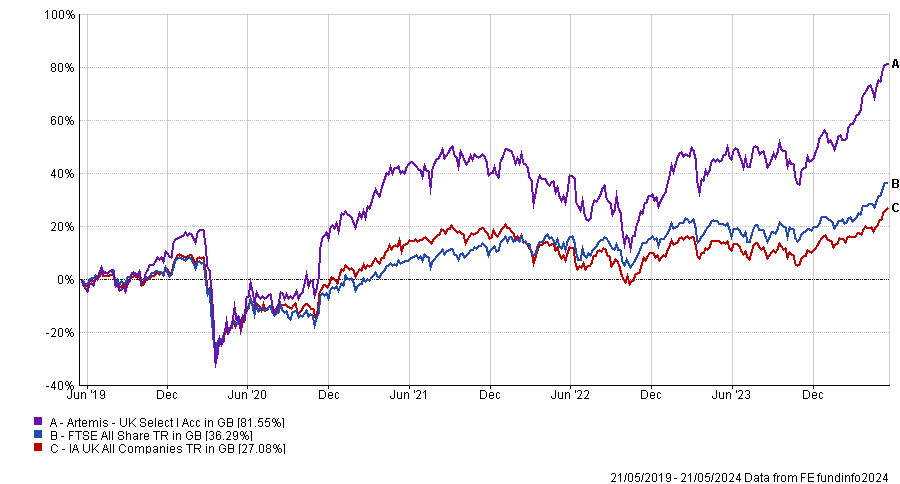
Source: FE Analytics
Three managers reveal their favourite stocks across different markets.
Nothing excites value managers more than good businesses trading at cheap prices, with bottom-up stock selection being at the heart of the investment process of many value-focused investment funds.
But knowing where to look is not always easy. At present, the UK, Europe and South Korea seem to be going through a popularity crisis, with many experts interested in companies from these markets.
Below, we collected a sample of stocks that have recently been on value managers’ radars.
UK companies
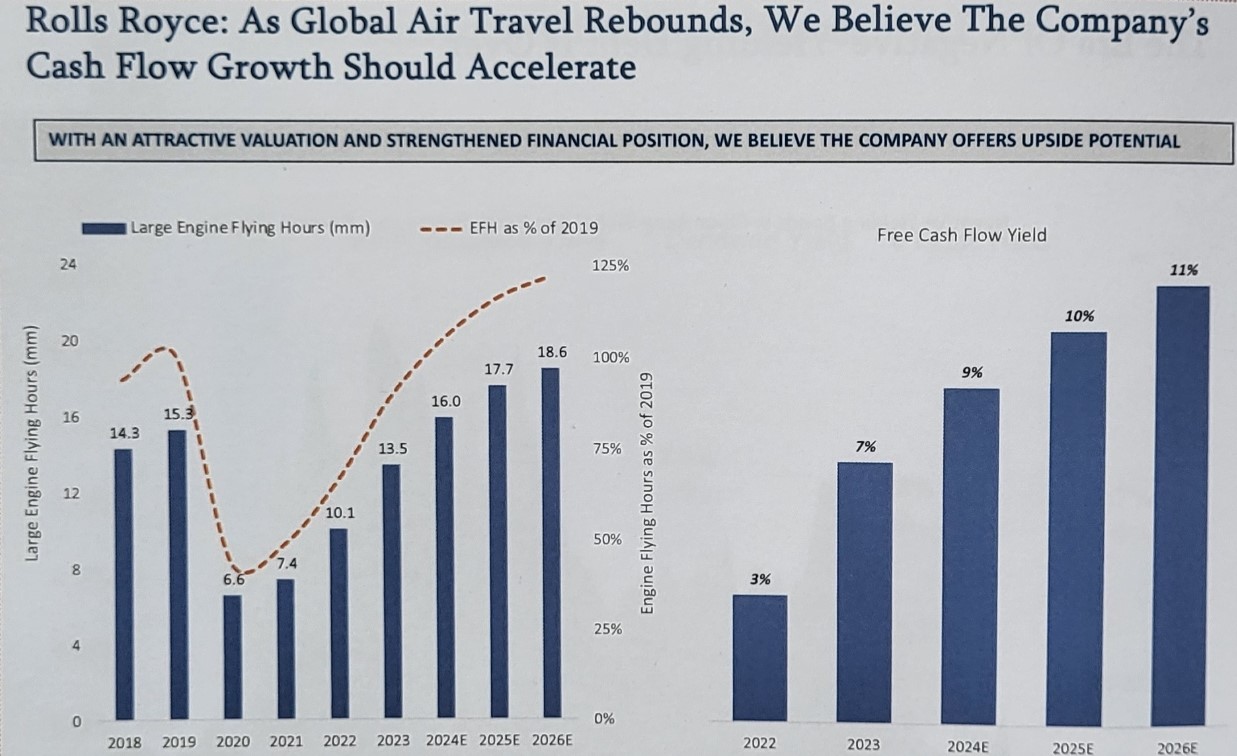
Sarah Ketterer, chief executive officer and portfolio manager at US-based Causeway Capital Management, highlighted plane engine maker Rolls Royce, the top holding in the Causeway Defined Growth fund.
As flying hours dropped in 2020, the company’s cash flow turned negative, which had an impact on the balance sheet, but it was during this crisis period that Ketterer began to accumulate a lot more of the stock.
“The reason why we were so bold with it is because this company has a fantastic competitive position. It is effectively in a duopoly with GE Aerospace. When earnings collapsed, the stock looked like it was very high-multiple, but that's where the opportunity is the best,” she said.
“Yes, flying hours have improved because planes are back in the sky, but it's what the management team did to make the business more efficient that brought in results. It was never in a situation where it would go insolvent, it had businesses to sell and very valuable assets, so it was just a question of getting the balance sheet recapitalised and focusing on being more efficient”.
Source: Causeway
Also on the manager’s radar was Prudential, which she highlighted for the growth momentum in its Asian business, improving capital management and its valuation, as the stock is trading on 12-year low price-to-book and price-to-tangible-book ratios.
Emerging markets companies
CIO and global portfolio manager at Antipodes Jacob Mitchell went for automotive manufacturer Hyundai Motor, in a market, South Korea, that has recently been gaining attention from value managers.
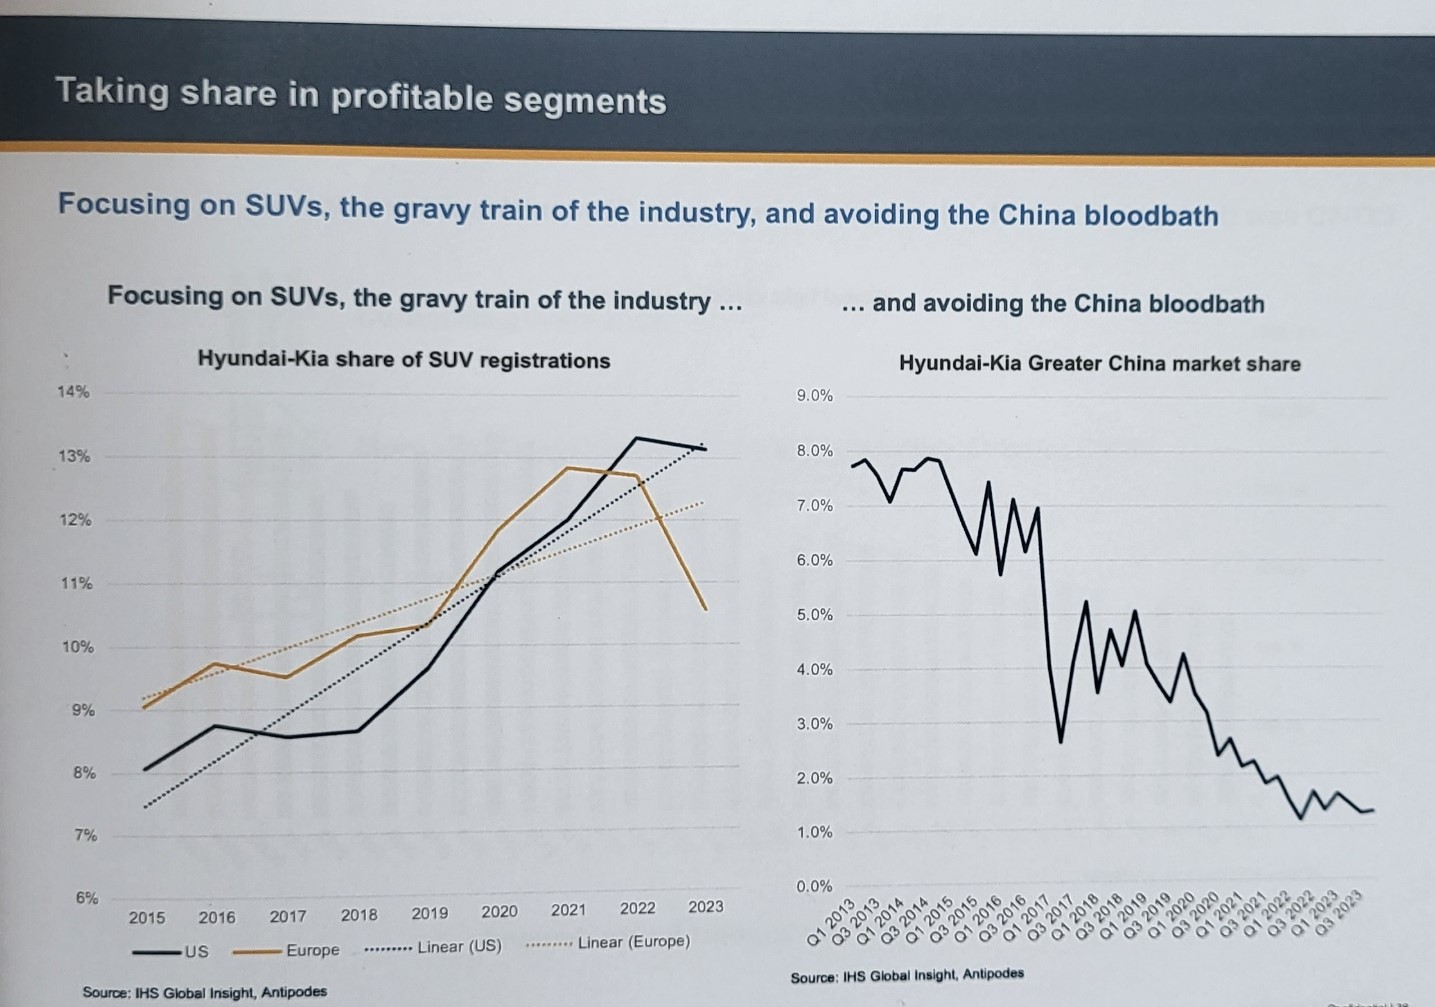
The company has been hurt by its position in China, with its market share in steady decline. But Mitchell said this was “a blessing in disguise”.
“Hyundai famously pivoted towards India, which has been an amazing success. India is in the early innings of auto adoption in what you can call a structural growth in terms of auto penetration,” he said.
The manager is particularly excited about Hyundai’s leading incumbent position together with Toyota and Honda, which are much better positioned, he said, compared with Tesla.
“Because of the saturation in the high-end electric vehicle market, Tesla's margins over the past 18 months – excluding deferred income and environmental credits – have gone from 18% to 2%. There is very little room left for it to actually invest,” he said.
“On the other hand, for the leading incumbents such as Honda, Toyota and Hyundai, margins are up over that period, so their ability to continue to incrementally invest is very strong.”
European companies
Clive Gillmore, chief investment officer (CIO) of Mondian Investment Partners, selected a stock that he said is the inverse of what people might think is exciting – Italian energy infrastructure company Snam.
Snam is in the business of transportation and storage of gas and re-gasification, that is changing imported liquefied natural gas (LNG) back into gas.
“Pretty straightforward and, frankly, pretty boring,” said Gillmore. This is compounded by Italy’s poor economic growth outlook and predictions of dwindling gas demand in Europe.
But in the stock, Gillmore sees an underappreciated growth story and a strong investment case both in the short- and long-term.
In the short term the case is “very positive”, with the company having “strong stability and visibility of earnings” in a 100% regulated industry. But the long-term too is better than people think, said the manager. Firstly, because dwindling gas demand accounts for only half the picture.
“Just like for the tube network, peak demand is what matters – not those who travel at 2:30pm, but at 6pm. Even though there might be a decline in overall gas use, peak demand is expected to increase. On top of that, Italy could also benefit from a chunk of the gas market moving away from Russia,” he said.
“Secondly, this is a utility company which earns money on return on its capital risk, and its capital expenditure is going to increase as gas companies invest in greener solutions to align with European Union stipulations expecting a move away from gas.”
Ketterer added a few more European picks, including Gucci’s parent Kering and rolling stock manufacturer Alstom SA.
The former is undergoing a re-vamp with less wholesale exposure, store remodels, marketing, talent hires and increased product quality. It is also poised to return “significant” capital to shareholders between 2025 and 2028, she noted.
Alstom SA meamwhile is improving on a “misstep” with the 2021 acquisition of Bombardier Transportation in an attempt to strengthen its global position in rail stock and signalling. It is now on a path to reduce net debt and achieve operational, commercial and cost efficiency, she said.
Robin Parbrook, manager of Schroder Asian Total Return, has been named FE fundinfo Alpha Manager of the Year.
Schroder Asian Total Return manager Robin Parbrook has won FE fundinfo’s Alpha Manager of the Year award, based on his long-term track record as well as recent performance.
Last year, his concentrated, best ideas strategy beat the benchmark by 9 percentage points and its peers by even more so. Parbrook attributed this outperformance to going overweight technology and underweight China. Stock picks in Australia and the ASEAN region also helped.
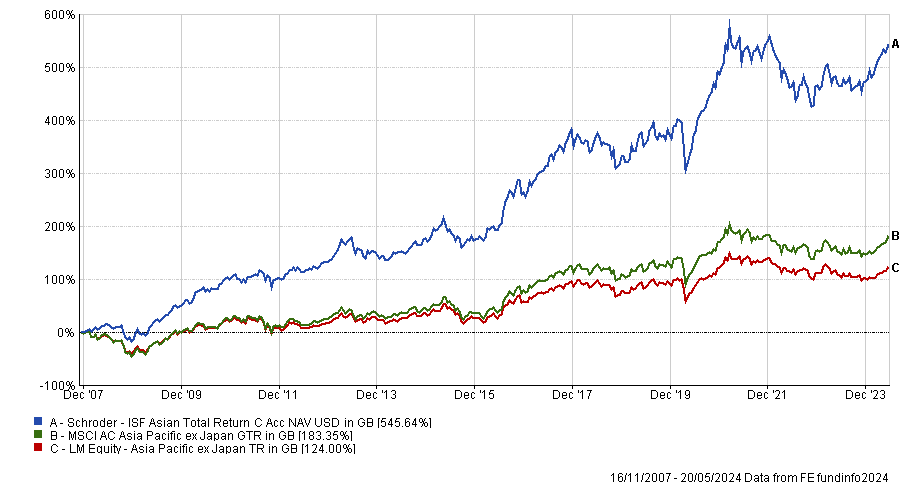
His £436m Schroder Asian Total Return investment trust returned 10.3% last year compared to just 1.3% for the MSCI Asia Pacific ex-Japan index and a 2.1% loss for the IT Asia Pacific sector.
Investors can also access the strategy via the $4.8bn Luxembourg-domiciled Schroder ISF Asian Total Return, which returned 7.4% in sterling terms last year, versus a 2.5% loss for its sector.
Performance of fund vs benchmark and sector since inception
Source: FE Analytics
Below, Parbrook tells Trustnet how he and co-manager King Fuei Lee use quantitative screens to take a view on countries, why they like tech and why they’ve taken profits in India.
Please describe your investment strategy
Parbrook: King Fuei and I believe that the Asian index is not the reason why people invest in Asia. It doesn't represent a good opportunity; you really should be completely unconstrained.
Schroders’ Asian equities team manages about $50bn and we have 40 analysts, each of whom covers about 25 stocks. Obviously we're not going to buy the sell-rated stocks, nor do we buy state-owned enterprises. We don't buy businesses that we don't believe have good long-term dynamics or where we don't trust the management, because in Asia you're always nearly always buying family-owned businesses.
That takes us down to a universe of about 200 stocks that are buy-rated by our analysts. King Fuei and I then pick the best 40 or 50 ideas.
We also have some stock screens looking at valuations and earnings momentum versus history. We look for upside to fair value, positive analysts grades and positive return on invested capital.
We leave the top-down perspective to quantitative models, which decide the level of beta to have in the fund and whether we should add capital preservation strategies.
How do your quant models work?
We have a country model for each of the main stock markets in Asia, which assumes mean reversion over time to a standard valuation matrix such as price to book, price to cash flow or dividend yields. The models forecast returns over one to two years based on historical trading patterns, valuation metrics and where we are in the business cycle.
At the end of 2022, markets were pretty bombed out in Asia. Our model was forecasting quite strong returns. Since then, China isn’t out of the woods but the rest of the Asian markets have done well.
At the beginning of this month, our model’s indicators were actually deteriorating. Following a strong rise in markets, the models were picking up on more earnings downgrades than upgrades. That means we should probably be looking to take some profits or rotate to more defensive stocks.
We also have a tactical model that looks out three to six months and incorporates economic surprise indices, inflation expectations and sentiment indicators. We then look at what ‘node’ we are in – in other words, when in the past has the economic backdrop looked similar to today and how did markets perform subsequently?
In the past couple of weeks, we have bought some puts on the Taiwanese index and the Australian index to provide some capital preservation. We’re trying to buy some cheap insurance just in case markets do fall because there is a bit of froth out there.
Puts are an attractive instrument to use because puts are cheap when markets have risen as they are a measure of complacency. We have also used VIX call options in the past. Again, they tend to be cheap when markets have just risen.
How are you positioned in China?
The main reason we performed well in 2023 was that we got China right. When China reopened last year (and this is one of the advantages of having a team in Shanghai) we could tell the animal spirits weren’t there. Reopening was a damp squib and we sold most of our Chinese stocks.
Our models are still quite cautious on China because business cycle indicators are negative and earnings downgrades are huge. Despite what the China bulls say, valuations in China are not cheap because of the lack of earnings momentum.
Another reason we're quite cautious on China is because there is irrational allocation of capital to anything that is a strategic priority for the Chinese authorities. State-owned capitalism will generate economic growth, but it will generate very poor returns on invested capital.
What were the other reasons behind strong performance last year?
The other positive contribution was the rebound in the tech stocks. The fund is nearly always overweight tech. We took a bit off the table at the end of 2021 but nowhere near enough, so we had some performance issues in 2022, but in 2023 the rebound in stocks such as Taiwan Semiconductor Manufacturing Company (TSMC) and MediaTek was helpful.
In Australia some of our healthcare stocks did quite well, while we were correctly cautious of Australian banks. A few stock-specific names in the ASEAN markets did well and that offset negative numbers in India, so those factors balanced each other out.
Why are you always overweight technology?
Tech stocks are the best companies in Asia. The best company I've seen in the 34 years I've been investing in Asia is TSMC by some margin because of its singular focus on process, process, process and delivering the best results. No-one can compete with TSMC’s leading-edge chips so it has genuine intellectual property and huge barriers to entry, which means it sustains a high return on invested capital.
Because TSMC is so dominant in Taiwan, it creates a clustering effect of good companies around it such as MediaTek, Realtek, Novatek, Advantek and Chroma, which is hard to replicate anywhere else. These are the best companies in Asia. This is what you want to own, in a nutshell.
MediaTek is one of the largest chip designers in Taiwan. It is taking market share and it benefits from having its main design centre in Hsinchu, right next to TSMC.
We are overweight semiconductors including Samsung and SK Hynix in South Korea so the next move is probably to take profits.
The semiconductor industry exhibits good solid revenue growth of 5% to 7% per annum. The world is continually becoming more semiconductor-intensive, but semiconductors fall in value every year because TSMC and Samsung drive prices down, which makes them fairly oligopolistic. It does mean that revenue growth is probably never quite as high as we think, because prices are falling whilst demand is growing very strongly. I don't think artificial intelligence really changes that.
How are you positioned in India?
We're actually slightly underweight India at the moment. The problem with India is that valuations increasingly reflect the good news so we've been taking profits, possibly too early.
In 2023, the one market where we clearly underperformed versus the benchmark in our stock selection was India, because we were too cautious. Domestic investors are quite active in India. They like growth and momentum and are not so worried about valuations. We are bottom-up value-orientated, so we really struggled to get our heads around why we’d pay 60-70x earnings for Indian consumer staples stocks.
We still like bits of the Indian market – healthcare, banks, some IT services companies – but in general, we have been relatively cautious just because of the valuations.
What do you enjoy doing outside of portfolio management?
I've always been a runner and I’m currently training for a half marathon with my daughter. I also play golf and I love hiking.
With fears of an economic hard landing abating and interest rates expected to stay higher for longer, a greater allocation to high yield can potentially boost the returns of a multi-asset credit strategy.
Following a period of interest rate normalisation, investors no longer need to reach down the risk spectrum for yield. It has been readily attainable in government bonds and money market funds.
However, while higher rates are good for these instruments, spread premia can be an additional draw for credit investors. Even when spreads are tight, investors can access attractive yields, especially in high-yield bonds, without having to veer into the lower-quality triple-C segment.
The benefits of a multi-asset approach
For credit investors, a multi-asset credit (MAC) approach can provide the broad diversification of risk while increasing yield and total return potential.
More conservative investors may prefer a portfolio with a greater weighting to investment-grade bonds given their relative safety and security in a variety of market conditions. Investment-grade yields are lower than in high yield, but investment-grade bonds can offer slow and steady income generation via the coupon, potential for low to mid-single digit returns and capital preservation.
Boost the juice
Those with a modestly greater risk appetite may consider a multi-asset credit approach with more high-yield exposure. The circa $2trn global high-yield market offers significant opportunities for investors able to identify credits with strong underlying fundamentals and we believe an attractive yield premium.
A well-structured multi-asset credit strategy can properly deal with the recent increase in bond prices. It can also invest during market dislocations and/or sell-offs. This can provide greater return potential through a longer holding period; the best opportunities tend to be during short periods of indiscriminate selling, not just when markets are going up.
One of the key features of high yield is its regular coupon income. Compounding this income and incorporating it into the price return provides an attractive total return picture over the longer term, as the chart below illustrates.
Capturing the premium in high yield
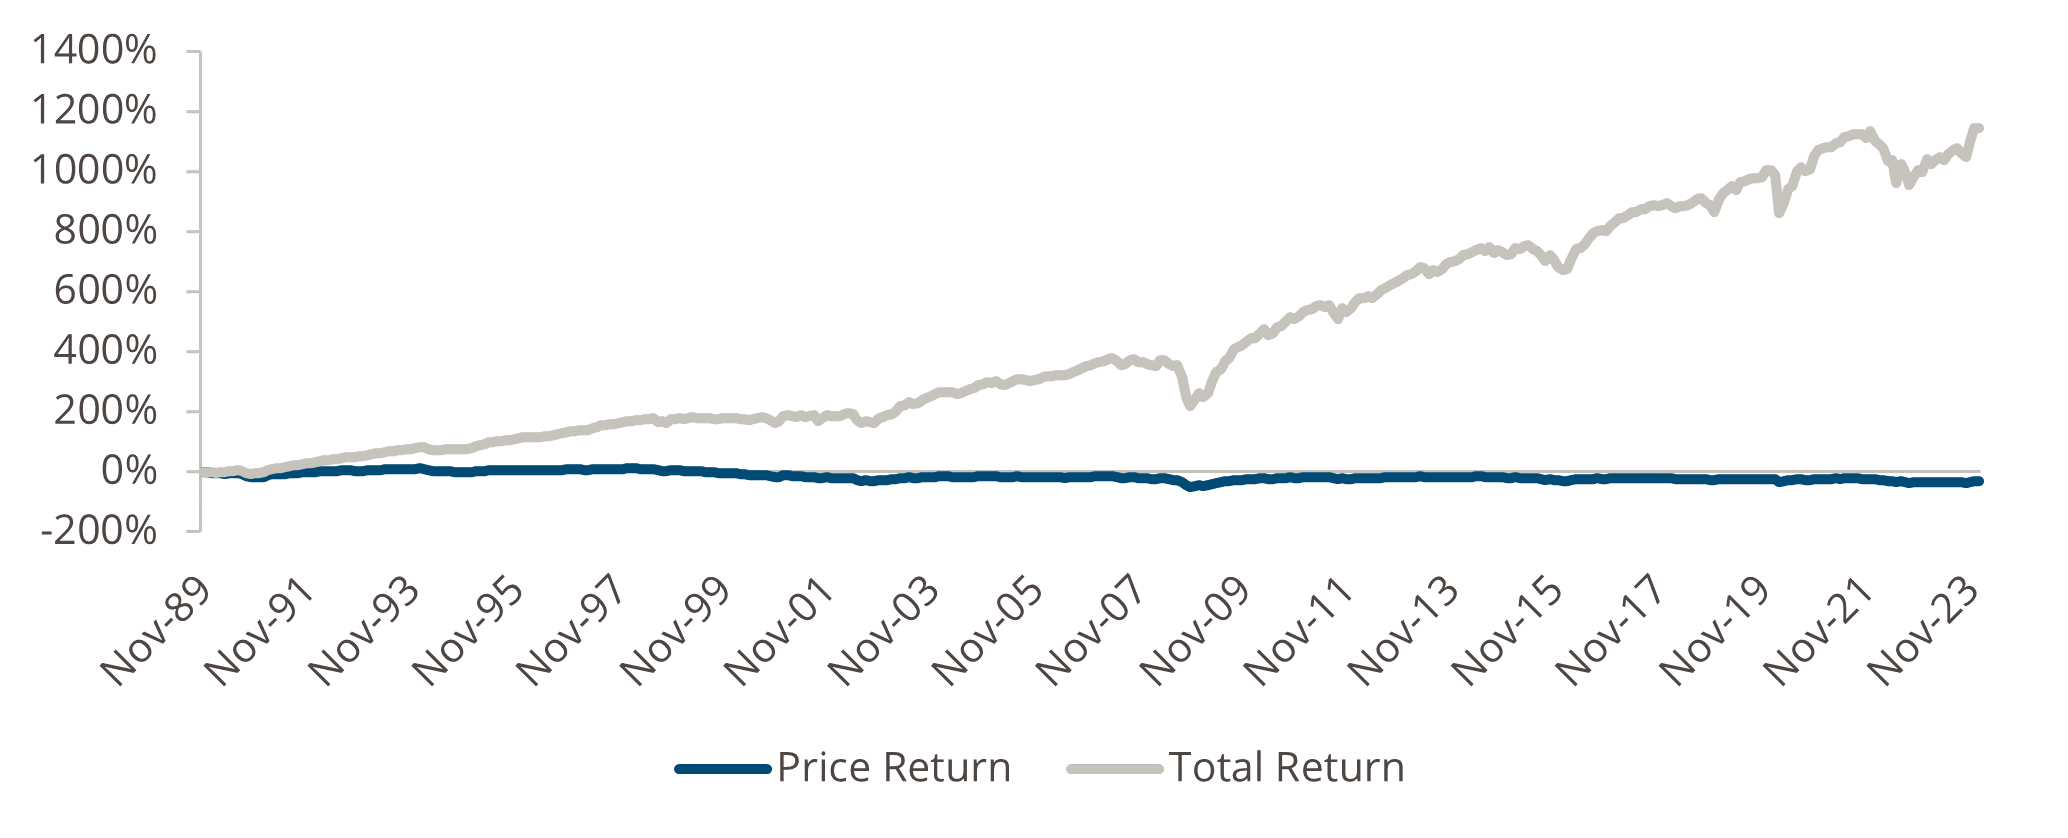
Sources: ICE Data Platform, ICE BofA US Cash Pay High Yield Index (J0A0) as of Dec 31, 2023
Risk on
High-yield bonds may be more volatile than investment grade, but investors should be able to tolerate higher volatility in exchange for additional yield, which is where credit selection comes in. A long-term approach to high yield means that, over time, yields can mitigate volatility.
Knowledge of rising and falling credit trends is also an important requirement. High yield comprises different industries operating within their own business cycles (cyclicals, financials, non-cyclicals, etc.). A multi-sector credit strategy that can identify emerging and maturing industry trends is therefore beneficial.
Stronger for longer
The inverse relationship between yields and price means that with higher yields come lower average prices. With prices at circa 93 in the US and 94 in Europe for example, an investor will receive an additional seven or six points when the price reverts to 100 at maturity.
Given the tendency of issuers to refinance before maturity, the discount is recouped over a shorter timeframe, resulting in a significant increase in yield and spread. While not a common phenomenon, it is present in today’s market conditions. The more commonly referenced yield-to-worst calculation may underestimate the potential realised return for bond investors reflected in the yield-to-call calculation.
Example services issuer 3.25% 2027 bonds
Sources: Muzinich, Bloomberg, data as of 8 Mar 2024
Abating recessionary fears and a higher-for-longer rates environment give high yield the green light. The asset class offers a compelling level of yield, while spreads compensate for default risk.
Credit quality is improving: only 10% of the global high-yield universe is CCC-rated. The investible universe – certainly in Europe – is shrinking, with a lack of supply underpinning prices.
While defaults are rising, they are likely to be limited given the underlying fundamental strength of high-yield corporates, especially in the higher-quality B and BB parts of the market. High-yield bonds also tend to have shorter durations, making them less sensitive to changes in interest rates.
For multi-asset credit investors, diversification is already part of the package. Yet those who want more risk and are willing to accept the volatility could consider strategies with a higher weighting to high yield, complemented by a smaller, but still beneficial, allocation to investment grade.
However, this shouldn’t be a short-term, tactical allocation. It should be a more strategic, long-term investment that seeks to benefit from deep credit analysis, as well as a strong understanding of market dislocations and the broader macroeconomic environment.
Mike McEachern is co-head of public markets at Muzinich & Co. The views expressed above should not be taken as investment advice.
RLAM, Man GLG, Janus Henderson and Schroders triumph in two categories each.
Schroder Asian Total Return manager Robin Parbrook has been named FE fundinfo Alpha Manager of the Year, achieving the highest scores across all asset classes for risk-adjusted returns and career-length outperformance.
Charles Younes, deputy chief investment officer at FE Investments, said: “Robin Parbrook’s win is testament to his perseverance and consistency in performance for his clients. His consecutive back-to-back nominations in this category reflect his successful career.”
Charles Somers of Schroder Global Sustainable Growth was crowned New Alpha Manager of the Year, having received the Alpha Manager designation for the first time in 2024, placing him within the top 10% of managers running funds for UK retail and wholesale investors.
Royal London Asset Management head of sustainable investment Mike Fox was the only person to win two awards, gaining accolades for global equity and responsible investing.
Jack Barrat and Henry Dixon at the helm of Man GLG Undervalued Assets won the UK equity award for the second year in a row. Their colleague Jonathan Golan, who took the New Alpha Manager title last year, returned this year to receive the sterling fixed income gong for his Man GLG Sterling Corporate Bond fund.
He was one of two bond managers on the podium and was joined by Richard Hodges of the Nomura Global Dynamic Bond fund.
Janus Henderson Investors clocked up two awards. Ben Wallace and Luke Newman were jointly recognised for outperformance in the absolute return sector and John Bennett took the European equities title.
The US equity award went to Aziz Hamzaogullari, founder, chief investment officer and portfolio manager of the Growth Equity Strategies team at Loomis, Sayles & Co. M&G Investments’ Carl Vine was recognised for Japan, while the emerging markets and Asia Pacific title was awarded to GQG Partners’ Rajiv Jain, Brian Kersmanc and Sudarshan Murthy.
Younes said: “The past few years have presented unprecedented challenges for the investment sector. From Covid-19 to international conflict, fund managers have battled high interest rates, political instability and rapid inflation.
“Everyone recognised at this year’s Alpha Managers awards has managed to achieve success and deliver value for clients in the face of these circumstances, thriving rather than just surviving.”
Rates could still appeal however, despite recent drops.
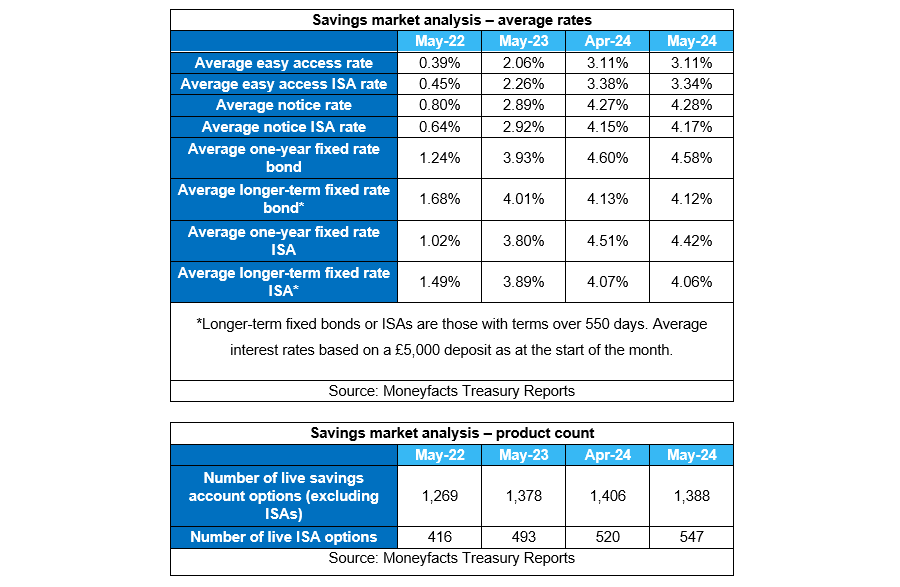
Cash ISA rates have fallen almost across the board this month while the yields from fixed-rate bonds also dropped ahead of expected Bank of England interest rate cuts later this year, new research from Moneyfacts has found.
The average easy access ISA rate fell month-on-month to 3.34% down from 3.38% in April, the first fall since January 2024. Meanwhile the average one-year fixed ISA rate was down to 4.42% from 4.51% and the average longer-term fixed ISA rate slipped 0.01 percentage points to 4.06%, its lowest point since June 2023.
There was a similar trend for non-ISA products too. The average one-year fixed bond fell for a seventh consecutive month to 4.58%, also an 11-month low, while the average longer-term fixed bond nudged 0.01 percentage point lower to 4.12%.
It means the longer-term bond average rate has now dropped by 0.90 percentage points in the past six months. The one-year bond is down 0.78 percentage points over the same timeframe.
Rachel Springall, finance expert at Moneyfacts, said: “It is worth noting that the extent of the latest month-on-month cuts were more subdued than over the past six months. Indeed, between the start of January and February 2024, the average longer-term bond rate fell by a staggering 0.34%, the biggest monthly cut seen in 15 years”.
Despite the cuts, year-on-year fixed bonds are paying much higher rates and “could still appeal to savers hoping to get a guaranteed return on their cash”, she noted.
The falls in rates come despite the amount of products available to savers rising slightly to 1,935, the most on offer since November 2023. This included 547 ISA deals – the most since Moneyfacts began collating the data in 2007.
The number of providers to offer a Cash ISA also rose up from 91 at the start of April to 95 the beginning of May, the biggest month-on-month rise in providers in three years and the highest number in more than 15 years.
“As providers enter the market and improve the availability of products in the aftermath of a busy ISA season, it will be interesting to see whether product choice continues to flourish in the coming months,” said Springall.
It was not all doom and gloom however. The average easy-access rate remained unchanged month-on-month at 3.11%, the first time it has not moved since December. This is positive, said Springall, as last month it experienced its biggest monthly drop since June 2020.
“Savers will still need to proactively check their accounts regularly and switch if they are getting a poor return,” she added.
Variable rates on easy access and notice accounts have also been “generally resilient” in recent months, and year-on-year, are paying more than 1 percentage point more across the board, which includes easy access and notice Cash ISAs.
The average notice rate nudged 0.01 percentage point to 4.28%, the first increase this year. The average notice ISA rate also rose to 4.17%, up from 4.15% in April.
Springall said: “Savers will find a combination of both rises and falls to rates month-on-month, but fixed bond and ISA rates reduced across the spectrum.
“Those coming off a fixed-rate bond would do well to consider the challenger banks which offer some of the best fixed bond rates, enticing deposits to fund their future lending.”
Indeed, based on a £5,000 lump sum, the best easy access savings account rate comes from Ulster Bank, which pays 5.2%, while the top one-year fixed-rate bond from Habib Bank Zurich pays 5.21%. This drops to 4.71% for three-year fixed-rate bonds and 4.57% for five-year bonds, both of which are offered by Shawbrook Bank.
For early-bird ISA savers, Plum offers the top easy-access rate of 5.17%, while Virgin Money has the top one-year rate of 5.06%. For longer fixed periods, again Shawbrook comes out on top, with its 4.41% three-year bond. For the top five-year rate, savers would be best turning to the State Bank of India, which pays 4.15%.
Expected US returns are likely to disappoint investors, said Redwheel’s Ian Lance.
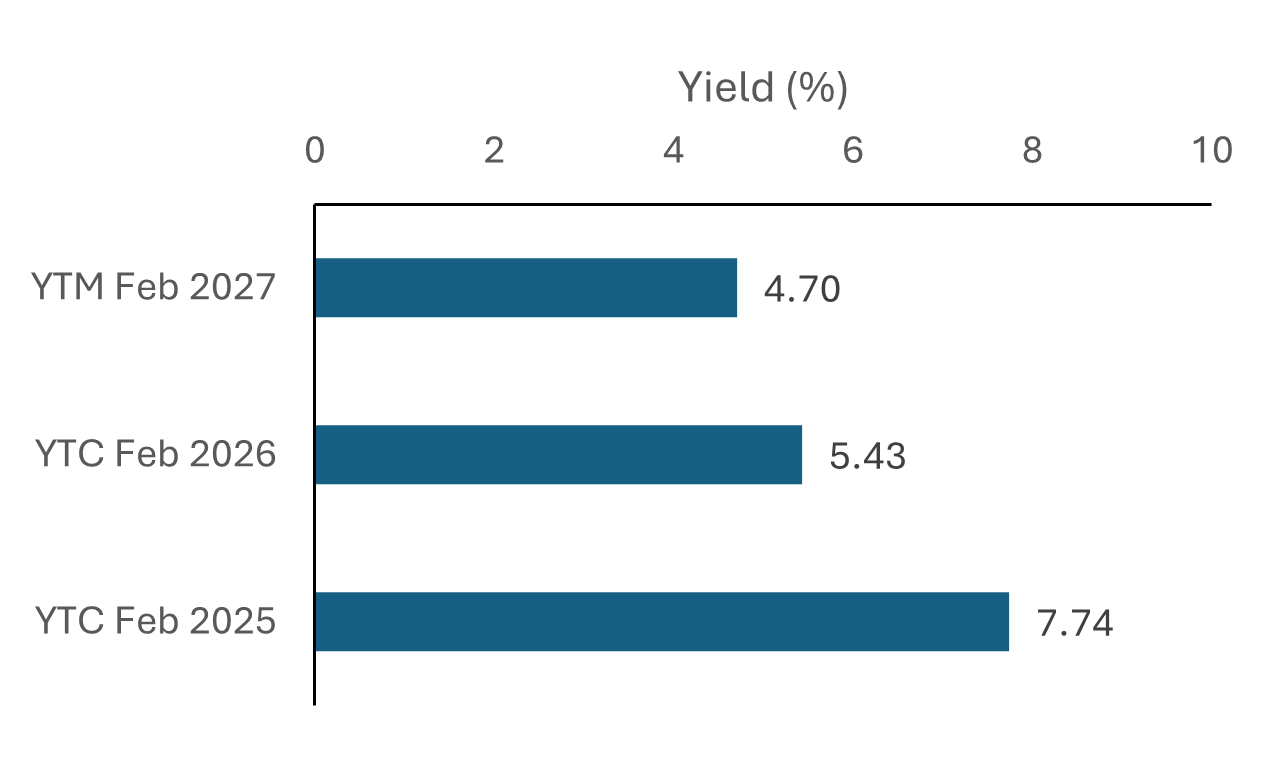
The US has been investors’ favourite market for more than a decade and particularly so in 2023 and 2024. However, Temple Bar manager Ian Lance warned fans of the New World should reconsider their positions or be willing to lose on average 4% of their money each year for the next 12 years.
For UK investors who maxed out their £20,000 ISA allowance this past financial year, this could mean be losing up to £7,745 by 2036, if that money was all invested in the S&P 500.
For investors who didn’t go all-in and allocated approximately 70% to the US – for example through the MSCI World index, whose weighting to the US is 70% – the losses from the US portion of the tracker on the £20,000 initial investment would amount to £5,422.
This is what can be drawn from the chart below, put together by John Hussman of Hussman Strategic Advisors. The culprit for this is valuations.
Market cap of non-financial US companies as a ratio to their gross-value added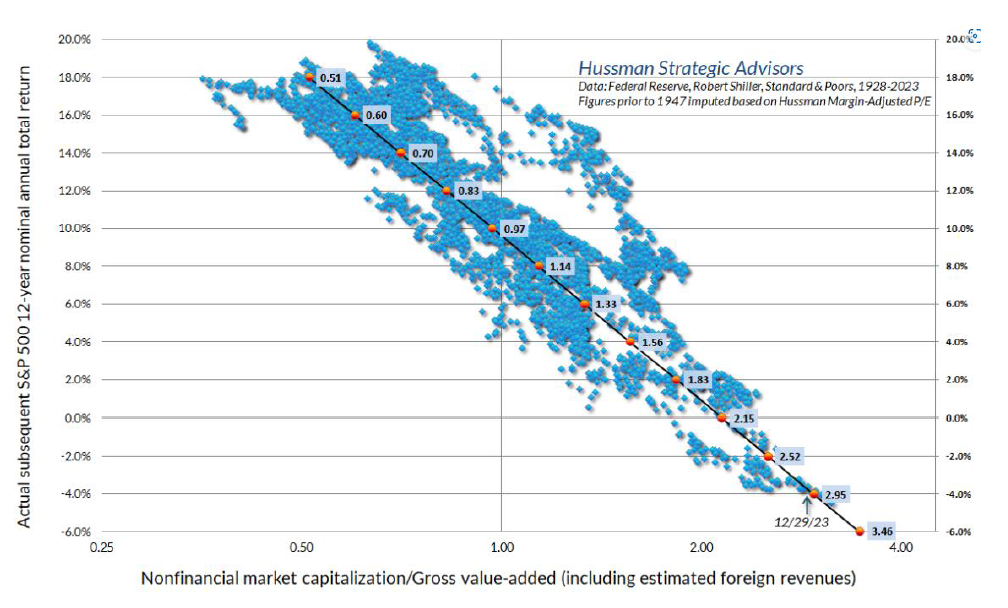
Source: Redwheel, Hussman Strategic Advisors
“The market has become too valuation-agnostic,” Lance explained. “People disregard them, but valuations do drive future returns.”
The chart above shows the US stock market’s annualised returns 12 years on from the point of purchase (on the y axis), in connection to valuations (across the x axis, cheap on the left-hand side, expensive on the right-hand side).
Unsurprisingly to Lance, buying the US market on a ratio of 0.5x made investors about 18% per year, while buying them off at an average valuation of 1x produced an average return of about 9%.
“And then just take a look at where we are today, over the far right-hand side of the chart. If that data holds, by buying the US stock market today you should expect to lose 4% per annum for the next 12 years.”
“Although the US looks this expensive, lots of investors that I know of have 70% of their clients' equity money invested in the US market on those very high valuations.”
Other US value managers agreed with Lance. One of them was Phoenix-based Cole Smead, manager of Smead US Value UCITS, who called the US “the most over-owned market in the world” and what’s going on in it “a craze and a mania”. He came to this conclusion using the chart below.
US household equity ownership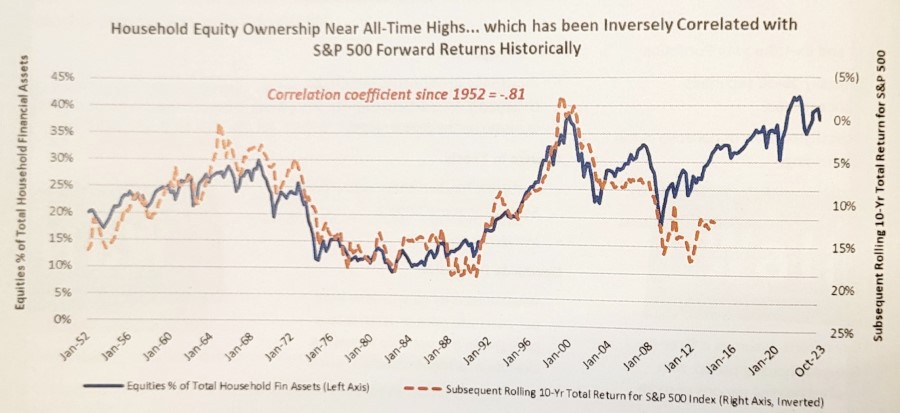
Source: Federal Reserve Economic Data, Bloomberg
The blue line shows American households ownership of stocks as a percentage of US household financial assets. There are three highs in this dataset – 1969, 1999 and 2021, which was the highest so far. The orange line displays the subsequent 10-year rolling-returns of the S&P 500.
“You'll notice the y axis starts negative on the right side and it ends positive on the bottom, and that’s because these two datasets have a powerful relationship to be negatively correlated,” Smead said.
“This is not particularly shocking. When everyone's excited about stocks, how does broad common stock participation United States do, as noted by the S&P 500? It does terribly.”
With this, the manager wants to prepare investors for the upcoming stock market failure, whereby the market will fail to make money in real (inflation-adjusted) terms.
In 1969, the 10-year forward return of the S&P 500 was 5.9%. If that sounds not too bad, there's a catch. The decade started with 6% inflation and ended it with 13.3%, amounting to a 4-5% real negative return.
Again in 1999, investors lost almost 1%. With 3% inflation during the decade of the 2000s, they ended up losing 3-4% in real terms, all of which are examples of stock market failure in Smead’s opinion.
“The highs in this data set argue that the S&P is going to make negative returns in real terms. When I hear people say that you can't lose money over 10 years in stock markets, I say you absolutely can. You can be broadly diversified and still lose money in stocks,” he said.
“The US is the most over-owned market, the biggest casino in the world. What's going on with the meme stocks [stocks such as Coinbase Global and Gamestop Corporation, which can maintain elevated prices regardless of their underlying worth thanks to their web-based popularity] is just evidence that this is a craze and mania and the biggest danger to global capital today.”
Retirees and those saving for retirement often invest in poorly performing funds, an AJ Bell study finds.
Some 90% of pension funds have failed to beat a UK equity tracker over the past decade, according to data from AJ Bell, which showed the scale of poor performance suffered by those saving towards retirement.
The benchmark has hardly been a demanding one. Indeed, the FTSE All Share index – which was used in this study – has been one of the worst performing markets globally over 10 years, as the below chart shows.
Around three quarters of the underperforming funds failed to beat the index by at least 10 percentage points, the study found, while more than a third were 20 percentage points behind or more.
It is worth noting however that not all are 100% invested in equities and will have other assets such as bonds and alternatives, which will have impacted performance.
Laith Khalaf, head of investment analysis at AJ Bell, said: “This doesn’t look like a market which is serving consumers well, and yet tens of billions of pounds are invested in pension funds posting disappointing performance.”
Performance of indices over 10yrs
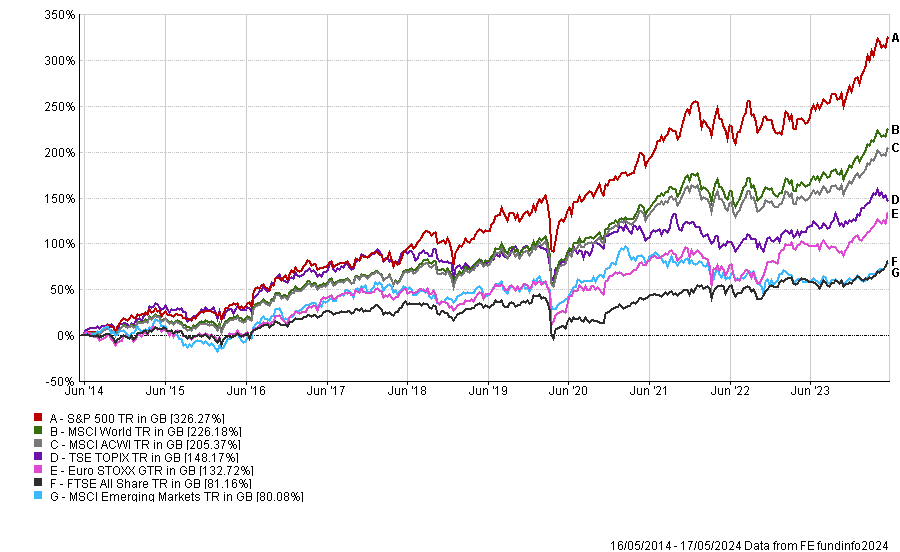
Source: FE Analytics
Included in the list of underperformers were Standard Life/Invesco Perp High Income 4 Pension, which was the worst of the group, making just 13% over 10 years. This included a 0.25% platform cost per year, which was taken into account, although pension funds have different share classes and it is possible some performed better than others.
Standard Life UK Equity 4 Pension (44.5%), SE Ethical Pension (46.7%), Scottish Widows UK Equity 2 Pension (47.5%) and Sun Life Canada CLIC Equity 1 Pension (47.7%) rounded out some of the worst “big funds with small returns”.
Poor performance can have seriously damaging effects in the real world, Khalaf said, as it will dramatically impact the size of savers’ pension funds when they retire.
“If you are able to get a 6% net return on a £50,000 pension pot for 20 years you will end up with £167,357. Reduce that return to 4%, and you end up £57,801 poorer, with a pot of just £109,556.
“Returns from the UK stock market itself haven’t been great over the past decade, but funds which have fallen significantly behind a tracker add insult to injury.”
There are several reasons why pension funds are performing so poorly. First is that many were set up decades ago before the invention of tracker funds. Instead, they invested in ‘closet trackers’ which charged active management fees, Khalaaf said.
Another is that charges on older pension plans tend to be higher. Khalaf said they “look high by modern standards, because they were set a long time ago before investment and platform costs started to fall”.
For example, Stakeholder pensions were popular in the early 2000s. They were marketed as a low-cost scheme with a maximum cost of 1.5% per year for the first 10 years and 1% thereafter.
“But you can now buy an index tracker fund for an annual charge of under 0.5% in a SIPP, and many successful active funds will cost less than 1% per annum including platform charges,” Khalaf noted.
The final reason is the “inertia tax”. This is a result of many pension schemes now being closed to new money, which has meant there is a lack of motivation to improve the products.
“The Financial Conduct Authority’s (FCA’s) Consumer Duty regulation will apply to closed books from July, which should in theory help drive improvements for investors in closed pension funds. There is still the risk that providers drag their feet, are hamstrung by the original pension fund mandates, or make improvements which still fall far short of the most competitive pension plans now available to savers,” the AJ Bell head of investment analysis said.
All savers should assess the performance of their pensions by requesting a performance factsheet and compare the fees they are being charged. Some older pensions can charge as much as 2.4% per year, according to a 2019 paper by the FCA.
“As a rough rule of thumb, you can now buy a UK tracker fund for around 0.3% to 0.5% including platform costs, and an active equity fund for around 1% to 1.2% including platform costs. Some active funds, especially multi-asset funds, cost significantly less,” Khalaf said.
If you are being overcharged or find you are in a poorly performing portfolio, it could be time to transfer to a cheaper or better performing option.
There is a rich vein of opportunity in European smaller companies that provide essential tools for the technology and healthcare sectors.
California in the 1840s was at the centre of the gold rush, which created enormous excitement, as prospectors and investors went in search of their fortune.
However, the real winners weren’t the gold mine owners or the landlords who leased the land but rather individuals such as Samuel Brannan, who became a millionaire selling picks and shovels to miners, and companies such as Levi’s (Levi Strauss travelled from Germany to California), which began providing durable clothing to workers.
Both Brannan and Strauss were able to profit from growth in the overall industry by providing critical products and services.
California is once again the centre of investors’ attention, and this time the excitement is about silicon, or, put more simply, technology. With the Magnificent Seven stocks (Apple, Microsoft, Nvidia et al) and the explosion of data creation, manipulation and storage, we see many parallels with the original gold rush.
Generative artificial intelligence (AI) and related services are turbo-charging data consumption, and the companies providing the tools that create and store this data stand to benefit most from the growth opportunity.
During this current gold rush, European companies once again are among those providing the ‘picks and shovels’.
Critical tools
Large companies such as ASML or ASM, two the world’s biggest suppliers to the semi-conductor industry, tend to get all the plaudits, but in Europe’s smaller companies universe there are several standout names providing critical tools and infrastructure to the supply chain.
There are two Swiss companies which, we believe, are well-placed to benefit from this structural trend. Firstly, VAT, the world’s leading vacuum valve producer, will see increased demand as more tools require high-integrity vacuums, with its valves (picks) being critical in getting to those ever-smaller node sizes.
The second, Comet, stands to benefit meaningfully from the AI revolution as more complex chip architectures are required, and in turn its plasma technologies become even more integral to the manufacturing process.
However, California’s Silicon Valley is not the only site of a current gold rush – we see structural growth in other areas. For example, health efficiency and the ability of blockbuster products to help reduce healthcare spending remains a focus given ageing populations and indebted governments.
As with the technology sector, stock market participants tend to focus on the headline names, for example Lilly and Novo Nordisk, when looking at the growth of GLP-1 based obesity drugs. But delve beneath the surface of the industry and analyse the supply chain and one can uncover some highly attractive ‘pick and shovel’ makers in the European smaller companies space.
Swiss company Bachem manufactures the ‘P’ (peptide) in the GLP-1 name – the key active ingredient for the drug. Capacity is in short supply and, with its reputation for quality and delivery, we think Bachem stands to benefit from the booming industry.
Dig deeper still into the GLP-1 supply chain and you find two German companies, Schott Pharma and Gerresheimer, which supply the devices (vials, synergies and injectable pens) that allow the drugs to be administered. These devices are designed into the manufacturing process, verified by the regulator and therefore hard to displace once the contract is won. This gives the companies and investors like us confidence in the future cashflows and growth trajectory of these businesses. Furthermore, there is a large and growing pipeline of biologic drugs in addition to GLP-1s that will drive demand for their products.
As we look across our portfolios, we see numerous other examples of ‘pick and shovel’ makers: Weir Group (mining equipment), Carel (control units for HVAC equipment), Tecan (sophisticated diagnostic machines for labs) and engcon (innovative tiltrotators to the excavator industry). The European smaller companies universe is rich with businesses that have important attributes.
One might ask, why not buy the company that is at the forefront of development — or the large-cap names we have all heard of? Because, as in the gold rush of the 1840s, we believe that by buying the pick and shovel maker, you are betting not on a single ultimate winner in the industry but on the entire industry winning.
Structural growth
By buying businesses that can grow along with industry volumes and more importantly provide unique and critical components for the industry’s infrastructure, you reduce the competitive (or regulatory) pressures often faced by the larger players, yet still benefit from the structural growth of the sector.
Our view is that investors will be rewarded by owning businesses that provide a specific service or product to the industry, where the competitive moat is high, where the products are ‘under the floorboards’ of the customers and where the industrial niche is relatively concentrated.
The European smaller companies sector is rich with businesses such as these. However, the focus on the Magnificent Seven in the US and the Super Six in Europe has meant less attention has been paid to this area of the market. We believe this allows investors to find businesses exposed to the same growth themes as well-known large caps – at more attractive prices. It also allows investors to diversify their risk, as often these companies provide for the entire industry, rather than being reliant on a single customer.
European smaller companies comprise a unique area of the global stock market, and with a quality growth philosophy one can access these ‘pick and shovel’ businesses and thus partake in gold rushes around the globe.
Phil Macartney is an investment manager, European equities at Jupiter Asset Management. The views expressed above should not be taken as investment advice.
Experts prefer UK small-cap funds with £60m to £200m, but a larger size is acceptable for US strategies.
The size of a fund is an important metric, as it can impact the manager’s ability to apply their investment philosophy.
This is particularly true for funds specialising in small-caps due to liquidity considerations. For instance, a fund that has become too big will have to take excessively large positions in small companies, creating concentration and liquidity risks.
Another risk is that the fund may have to increase its exposure to larger, more liquid businesses, which would dilute its genuine small-cap exposure. In other words, this could turn a small-cap fund into a mid-cap portfolio.
Kamal Warraich, head of equity fund research at Canaccord Genuity Wealth Management, said: “A small-cap fund’s maximum size is based on ‘capacity’, which is essentially how big a total strategy can get (strategy meaning all funds and mandates run under the same philosophy and process) before it has to abandon its current investment approach.
“Many things can impact a strategy, but the most important considerations in my opinion are: size and speed of fund inflows, breadth and depth of the investable universe and liquidity profile of the fund.”
There is, however, no magic number for how big a small-cap fund can get before its size becomes a hurdle. It depends on the average market capitalisation of underlying companies, the size of positions the manager intends to take and the breadth of the market.
Nick Wood, head of fund research at Quilter Cheviot, said: “For example, small-cap investors in the US are likely to hold much larger and more liquid companies than counterparts elsewhere simply down to the structure of that market."
While US small- and mid-caps tend to be relatively large and would, in some instances, be considered large-caps if listed elsewhere, UK and European smaller companies are much less liquid.
Rob Burgeman, investment manager at RBC Brewin Dolphin, said: “The perils for a larger fund, then, of finding themselves stuck in lobster pots – investments that they can get into but not out of – are increased.
“This can be a problem, as successful strategies attract greater flows of funds. These funds then pour into the same holdings, boosting their prices further and increasing the returns of the fund. However, when the tide turns, the fund manager can find that the only buyer of some of their larger holdings was themselves. Prices then start to fall sharply, redemptions increase, and it becomes something of a vicious circle.
“Good fund management houses will soft close and then hard close their funds to prevent them growing too large and avoid this issue.”
For UK smaller companies funds, which invest in a less liquid market, the sweet spot is under £200m, saidTom Hopkins, senior portfolio manager at BRI Wealth Management. A size range between £60m and £200m is “ideal for active, concentrated, yet liquid portfolios”.
He warned against funds exceeding £500m in assets under management as they may need to increase their exposure to large- and mid-caps.
While smaller funds are generally better in this asset class, there are risks associated with buying units in tiny funds.
Hopkins explained: “The risk of investing in a fund that’s too small is that your deal size could make you a significant shareholder within the fund, which some investors may find uncomfortable.”
While Hopkins would back a fund as small as £60m, Burgeman is wary of funds under £100m.
“A micro fund is going to struggle to generate the returns required to be financially viable for the fund management group, leaving it exposed to the prospect of being abruptly shut or merged with another strategy,” Burgeman said.
“This is okay, maybe, if a fund has just launched and there is reasonable prospect of it reaching critical mass within an acceptable period.”
Small-caps have been deeply out of favour in the UK and elsewhere in recent years. Data from the Investment Association showing that the size of small-cap equity funds has contracted from £14.5bn five years ago to £9.8bn today, as a result of both outflows and disappointing returns.
Yet, easing inflation and the potential for rate cuts this year could benefit smaller companies, which are trading at significantly lower valuations than the wider UK market.
Hopkins concluded: “As smaller companies remain undervalued, we will continue to see heightened M&A activity from overseas and private equity buyers if these valuations continue.
“For a long-term investor, the current valuation of the UK small-cap market provides an attractive buying opportunity as the market still has plenty of high-quality and exciting businesses for investors.”
Jefferies and Peel Hunt one, short sellers zero as the brokers’ buy ratings prove prescient.
Hargreaves Lansdown’s volatile share price has rebounded strongly since March 2024, although it is still way off its 2019 peak. Broker Jefferies has issued a buy rating for the platform’s stock in the belief that its fortunes are turning around under new chief executive Dan Olley and Peel Hunt recently reaffirmed its buy rating.
Nonetheless, Hargreaves Lansdown remains one of the UK’s most shorted stocks judging by the percentage of its share capital disclosed to be in the hands of short sellers (5.5% at the end of April 2024, according to the Financial Conduct Authority).
Hargreaves Lansdown’s share price year-to-date vs FTSE 250
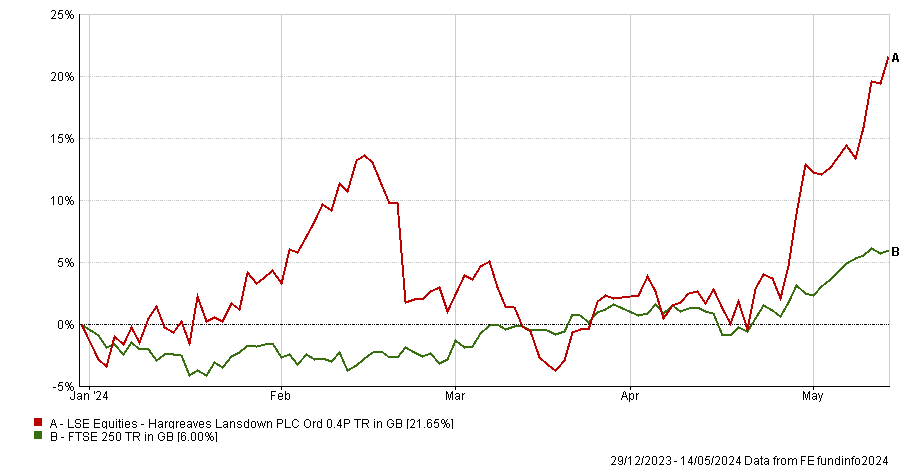
Source: FE Analytics
Analyst recommendations are split with six analysts expecting Hargreaves Lansdown to underperform, five saying it will outperform, three buys, four holds and one sell, according to the Financial Times as of 9 May 2024.
So, who is right? And should you buy, hold or fold Hargreaves Lansdown’s shares?
Eric Burns, chief analyst at Sanford DeLand, sides with Jefferies and Peel Hunt. Hargreaves Lansdown is a high beta play, so he expects its shares to perform well if the UK and global stock markets – which hit fresh highs last week – continue to rise.
“I struggle to follow the logic of being short a stock like HL when the FTSE is reaching new highs on a daily basis. Rising markets provide an organic uplift to assets under administration – HL’s key performance metric – even without it adding new customers,” he explained.
“Following the sell-off, we have a business with a free cash flow yield we estimate of about 7.1% this year, rising to 7.5% next. This puts it very much in the ‘value’ category.”
Peel Hunt agreed that the platform looks cheap. “Hargreaves Lansdown is now trading on a December 2024E EV/EBIT of c.8x, or a price-to-earnings ratio of 12x, well below the other listed platforms,” the broker said on 30 April 2024, reiterating its buy recommendation. “We do not believe the longer-term prospects are being reflected in the share price.”
Sanford DeLand has held Hargreaves Lansdown (HL) in its CFP SDL Buffettology fund since October 2014. It also owns AJ Bell in its CFP SDL Free Spirit fund. “We love platform businesses; they are very scalable and tend to exhibit the sort of returns we are looking for,” Burns said.
“In the case of HL, return on average equity is in excess of 50% and conversion of reported earnings into free cash flow is high. Despite all the negativity you will hear, this is a business that has grown revenue at a 10%+ compound annual rate over the past 10 years during which time active clients have gone from 507,000 to over 1.8m. It’s the sort of steady compounder we like.”
Hargreaves Lansdown has benefitted from the higher rate environment through its popular Active Savings product which enables savers to achieve a better rate of return on cash, Burns added.
“There have also been regulatory concerns regarding the interest platforms earn on client cash balances although this appears to be ameliorating,” he noted.
Julian Roberts, an equity analyst at Jefferies, argued that although Hargreaves Lansdown is not the cheapest investment platform, its pricing is competitive – and fees are not as critical to customer loyalty as the platform’s detractors may believe.
“Platform fees of 45 basis points (bps) are capped at £45 a year for shares. On an average account size of c. £75,000, that is 6bps. It is more than AJ Bell, which caps out at £25 (3⅓ bps), but the £20 difference is quite slim in the scheme of things, and HL would point to execution cost savings due to their larger size and network. This does not hold for all asset classes, but absolute differences are not huge,” Roberts explained.
“Perhaps more importantly, in our survey of UK savers this year, the two most expensive platforms were also the most popular, so we doubt that the target market is as price sensitive as people might think. Brand and service probably matter more.”
Roberts thinks that Hargreaves Lansdown’s sheer size masks its success at bringing in new customers. “HL fishes for new clients in the same pool as all of its competitors, but it loses them from a much bigger one. Lose 10% of 1.8m customers, and you need 180,000 new ones to replace them. AJ Bell can lose 10% and only need 35,000 new ones to grow,” he said.
“HL added 34,000 net new customers in the quarter to March 2024, versus 15,000 at AJ Bell, but the gross numbers are even further apart. We see this as a sign of brand strength.”
For Hargreaves Lansdown, this represented a 48% jump in net new clients compared to the first quarter of 2023, as its new cash ISA and ready-made pension portfolios proved popular.
Positive market movements also helped the platform to grow its assets under administration by 5% during the first quarter of this year to £149.7bn, according to Peel Hunt. Net inflows improved to £1.6bn, which was above consensus expectations.
Since coming onboard as CEO last year, Olley has had “a real impact”, Roberts continued. The former dunnhumby boss has “re-jigged the sequence and content of the investment programme, replaced the chief technology officer, brought in a new strategy office and a new corporate affairs director, and there have been results”.
The most recent addition to the investment programme is a range of passively-managed model portfolios, which will start trading next month.
On the other side of the equation, short-sellers have had plenty of reasons to bet against the stock during the past few years.
Having owned the platform for a decade, Burns acknowledged its fall from grace. “If you combine difficult market conditions with the unwanted connection to the [Neil] Woodford affair and a spat with its founder then I guess that’s fodder for the shorters,” he said.
The platform’s shareholders, Burns included, are hoping these headwinds are in the past and that momentum has turned in Hargreaves Lansdown’s favour.
In a further potential fillip to shareholders, Burns suggested that HL might join the increasing ranks of British companies catching the attention of overseas buyers.
Morgan Stanley’s MS INVF Emerging Leaders Equity fund and Carmignac Portfolio Emergents outperformed the most over five years.
Active investing is all about stock selection and outperforming indices in order to give investors extra returns that they can’t get through passive funds.
By outperforming their benchmarks, managers can show that their decisions have benefitted the fund, keeping investors happy and justifying their higher fees.
In this series, Trustnet is looking at funds’ outperformance, as measured by alpha, over the past 61 year-long periods measured every month from 2018 to 2023.
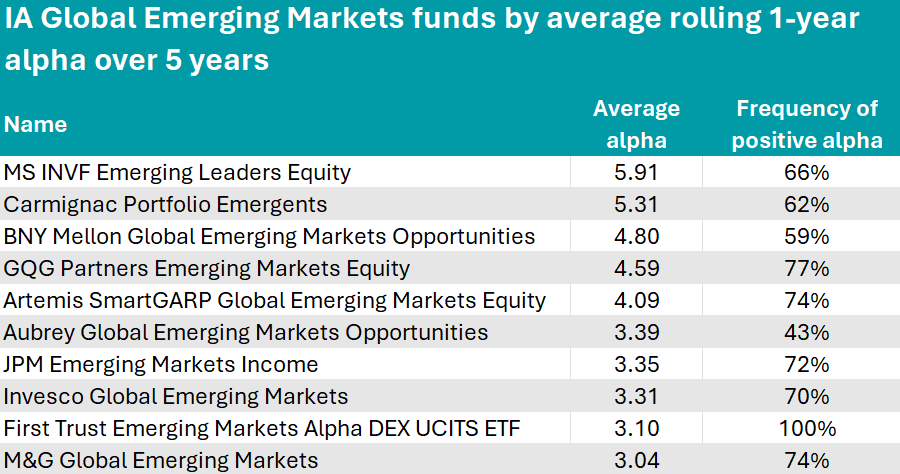
Today, we analyse the IA Global Emerging Markets sector, where the Morgan Stanley Investment Management’s MS INVF Emerging Leaders Equity fund had the highest alpha score.
The $955.6m fund follows a benchmark-agnostic investment process whereby the manager Vishal Gupta focuses on companies that are poised to benefit from future growth themes.
His top three stocks are Brazil-based digital banking firm Nu Holdings (8.3%), Argentinian online marketplace MercadoLibre (7.4%) and Taiwan Semiconductor Manufacturing Company (7%).
Over the past five years, the fund outperformed its benchmark, the MSCI Emerging Markets index, by an average of 5.9% per annum.
Source: FinXL
The second-best fund was Carmignac Portfolio Emergents, with an average alpha of 5.31.
It is co-managed by Xavier Hovasse and Haiyan Li-Labbé, who combine a fundamental top-down approach with bottom-up analysis. The fund’s main country exposure is China (27.9%), followed by South Korea (18.4%) and India (14.4%). The top holding is Samsung (9.9%).
In third position, BNY Mellon Global Emerging Markets Opportunities concluded the podium with an average alpha of 4.8. It is managed by Liliana Castillo Dearth, although she joined Newton Investment Management in October 2023 – the fund’s track record prior to that was built by former managers Paul Birchenough and Ian Smith.
Other notable strategies in the list included the value-focused Artemis SmartGARP Global Emerging Markets Equity fund (average alpha: 4.09), which is recommended by FE Investments analysts as a core emerging-market fund. Its investment process “goes beyond deep value and distressed stocks to include a wider variety of factors”, they said.
The Aubrey Global Emerging Markets Opportunities fund (average alpha: 3.39) has a “strong consumer focus and growth-bias”, FE analysts said, making it a good fund for secondary exposure
Finally, the five FE fundinfo Crown-rated JPM Emerging Markets Income (average alpha: 3.35) also deserves a mention.
“In tough environments such as 2020, where many companies looked to cut their dividend payments, this fund’s ability to focus on capital appreciation provided it with resilience and the capacity to maintain total return generation in downward markets,” FE analysts said.
“Unlike traditional income funds, this fund takes a more flexible approach, in that capital appreciation is as equally important as income generation. The fund is best suited as a core emerging market exposure, with defensive characteristics for those seeking a source of income.”
There was only one fund in the whole emerging markets sector that consistently delivered a positive alpha throughout the past five years – the First Trust Emerging Markets AlphaDEX UCITS ETF.
With just £15.3m of assets under management (AUM), this overlooked exchange-traded fund (ETF) has beaten the benchmark it is tracking, the Nasdaq AlphaDEX EM index, with an average outperformance of 3.1% – higher than many active managers in the sector.
For this, it only charged 0.80%, in a sector where the average ongoing charges figure (OCF) is approximately 0.95%. Its main exposures are to China (18.1%), Turkey (15.3%) and Taiwan (11.63%).
At the bottom of the table were funds with negative alpha, whose managers’ active decisions detracted from performance rather than contributed to it.
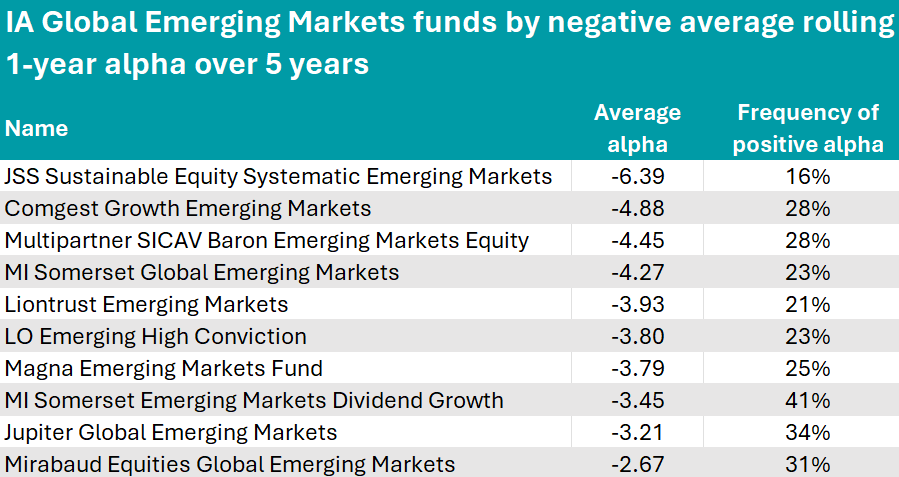
Source: FinXL
The most negative scores were those of JSS Sustainable Equity Systematic Emerging Markets (-6.39), Comgest Growth Emerging Markets (-4.88) and Multipartner SICAV Baron Emerging Markets Equity (-4.45).
Sectors previously in this series: UK Equity Income, UK All Companies, Global, Global Equity Income, Sterling bonds, smaller companies, global bonds, cautious funds, balanced and adventurous funds, European funds, Asia funds.
Prashant Khemka, manager of Ashoka WhiteOak Emerging Markets, believes that managers who don’t beat their benchmarks should not charge fees.
Ashoka WhiteOak Emerging Markets was one of just two investment trusts to go public last year amidst a period of drought in new listings for the London Stock Exchange.
This new fund aims to replicate the success of its stablemate Ashoka India Equity by applying the same investment philosophy to the broader emerging markets universe.
The £35m investment trust made the headlines again recently as it is looking to absorb its much larger peer, Asia Dragon Trust, to grow its assets under management and get onto the radar of a wider investor base.
Performance of fund
Source: WhiteOak Capital Management
Below, the founder of WhiteOak Capital Management, Prashant Khemka explains his strategy, how the investment trust structure enables him to generate higher alpha and why managers who don’t outperform their benchmarks should not charge fees.
Could you explain your investment strategy?
A crucial prerequisite to generate sustainable, peer group-leading performance over many years and market cycles is to have a robust investment culture. Everyone in our team is driven by a single-minded objective: to generate the highest return compared to anyone else in the peer group. We don’t have a top-quartile or top-decile mindset, but a sportsman-like mindset: we’re aiming for the gold medal.
We follow a stock selection-based approach, underpinned by the belief that outsized performance is generated by investing in great businesses trading at attractive valuations. We use an analytical framework, which also serves as a valuation framework, called ‘OpcoFinco’.
From a risk management perspective, an end objective is to maximise alpha while also minimising the volatility of that alpha.
What is the OpcoFinco framework?
To generate cash flow sustainably in the future, a company needs returns on incremental capital to be higher than the cost of capital.
When you find businesses that possess these attributes, you must value them logically and invest only if there is a substantial upside to fair value.
The OpcoFinco framework enables you to analyse a company through the prism of return on incremental capital and then to quantify the value of return on incremental capital.
Unlike many people, we don't use the price-to-earnings ratio at all. We think it's very misleading because it is distorted.
Could you explain your fee structure?
We have a 0% fixed management fee structure. We charge a performance fee on a three-year cumulative alpha basis, which means we only get paid if we outperform. The alignment of interest is strong because we can't just sit on our laurels and expect to get paid.
There are too many investment trusts out there that have never generated alpha, but are charging fees on an ongoing basis. There's very little accountability and I'm quite surprised to find that the accountability level is not as high as I would have expected in a developed market like the UK.
The 0% management fee combined with the annual redemption facility and performance of the trust should keep the discount very tight. In the case of Ashoka India Equity, we've generally been trading at a small premium versus a 15% to 20% discount for most of our peers.
Why did you choose the investment trust structure?
Emerging markets are inefficient segments of the global equity market and we have an overweight to small and mid-cap (‘smid’) companies because it’s an even more inefficient part of emerging markets. Being overweight smids doesn’t mean you are going to outperform but a good management team can generate higher alpha in that space.
Because it's closed-ended, the investment trust structure enables us not to worry as much about liquidity. Hence, we can allocate more capital in small-cap companies, which may not be appropriate from a liquidity management perspective in an open-ended vehicle.
It also allows investments in pre-IPO opportunities. It’s not possible to explore those opportunities in open-ended vehicles.
What has been the best-performing stock in the portfolio since launch?
The best performer has been Doms Industries, which is an Indian stationery and art material manufacturer. It produces things such as pencils, erasers and mathematical instruments. Basically, things students would use in school.
When I grew up, Doms wasn't around. We used all kinds of pencils that weren't necessarily branded. But now when I go back to India, I see that all the kids in the family are using Doms products.
Fila Group from Italy is an investor in Doms Industries and owns a good amount of its shares.
What about the worst-performing stock?
It has been Budweiser Brewing Company APAC, which is listed in Hong Kong. The Chinese market has been under tremendous pressure and most of our Chinese names are down 11% to 44%.
Following the reopening of China after Covid, it was expected that the demand for beer consumption would substantially normalise and get back to its earlier growth path, but like many other segments of the Chinese economy, consumption has been fairly tepid.
That is why Budweiser has derated.
The portfolio is underweight China relative to the benchmark. How do you approach this market?
We never form top-down views such as ‘China is in deep trouble, so we will underweight this market.’
However, the portfolio is overweight the most democratic countries and underweight the least democratic countries. We believe authoritarian regimes have lower alpha potential. Similarly, we are underweight state-owned enterprises and overweight private companies.
Now, if you reassign some of the companies in the portfolio that are exposed to China like South Africa’s Naspers (which has a sizeable stake in Tencent) as well as some off-benchmark names, our allocation to China is more or less in line with the benchmark.
How do you select your off-benchmark positions?
Most of them have three attributes: they derive the majority of their value from emerging markets, are high alpha opportunities and mitigate some factor risks in the portfolio.
For example, if you take France’s LVMH, 60% of its growth was driven by China alone in the 10 years prior to the Covid crisis and we estimate that a majority of its profits still come from emerging markets. It mitigates the underweight risk in China.
Similarly, Netherland’s ASML derives the majority of its value from emerging markets, has high alpha potential and mitigates the underweight risk in Taiwan.
What do you do outside of fund management?
I like to spend time with my family. I have three kids and we have a fund management competition going on between them. They have their own portfolios and try to outperform each other. It’s good fun to see the industry within the family as well.
UK equities hit an all-time high this week but there’s plenty of petrol in the tank to continue fuelling this rally.
The UK equity market hit fresh highs this week and, while no-one wants to get in at the top of any market, there are many reasons to believe that this rally might only just be getting started.
With the benefit of hindsight, we would all have boosted our domestic equity holdings months ago, but some investment professionals think now still seems like a relatively opportune moment to get in on the action.
While many catalysts have converged to produce the recent rally (including an improvement in economic data, imminent rate cuts and voracious share buybacks) there are plenty more irons in the fire yet to make an impact.
FTSE 100 and FTSE All Share vs MSCI ACWI, year-to-date
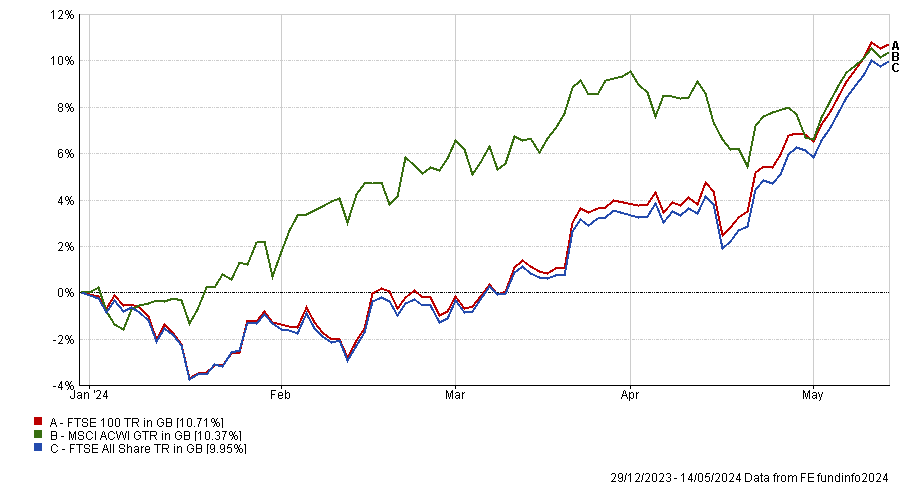
Source: FE Analytics
One factor that could really move the dial would be inflows.
As Artemis Income’s Nick Shenton pointed out, the UK stock market has “been making all-time highs on a total return basis for a while [but] it’s not doing so from an extended position where it’s widely owned or the shares don’t [offer] value. We think it bodes quite well that it’s starting to make all-time highs without the aid of international investors coming back to the UK market, or even domestic investors”.
Meanwhile, private investors continue to pull money out of UK equity funds, channelling it instead into passively-managed global and US equity funds. Asset managers are bullish about the prospects for US large-cap stocks and European equities but not the poor old UK. Even wealth managers such as Coutts are turning their back on the UK – at precisely the wrong time, in my view.
The UK government is doing its best to stem the tide of outflows, launching the British ISA which is not expected to move the needle massively, but is a step in the right direction. It proves there is political will to take action to support the stock market, which is why Man Group’s Henry Dixon called the British ISA announcement in the spring Budget “a faint line in the sand moment”.
Jack Barrat, who co-manages Man GLG Undervalued Assets with Dixon, said the chancellor’s call for UK pension funds to disclose their allocations to domestic equities should give the stock market more “sunlight” and “greater attention”.
If the government were to go one step further and abolish stamp duty, that could encourage investors back into the stock market.
Valuations remain attractive despite this year’s gains, as the chart below shows.
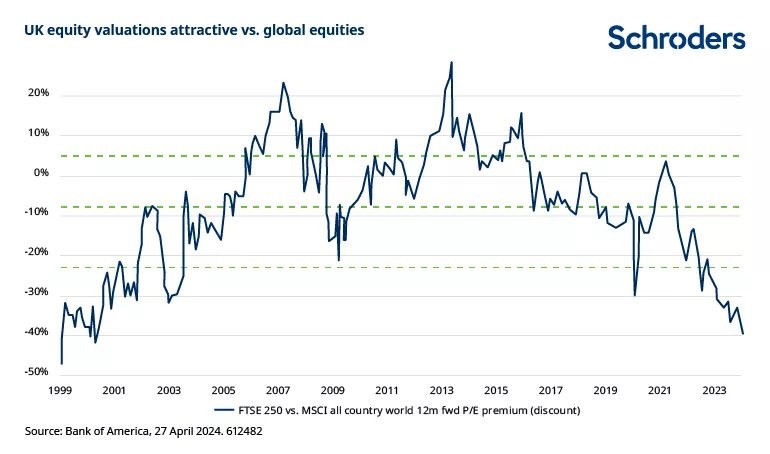
Marcus Weyerer, senior ETF investment strategist, EMEA at Franklin Templeton, said: “With a price-to-book ratio of less than 2.0, UK equities are currently trading at a discount of more than 50% compared to US equities. Additionally, in terms of forward price-to-earnings, they are closely aligned with emerging market levels. Furthermore, the UK has long been considered a haven for income investors, and it currently boasts a dividend yield of 3.8%.”
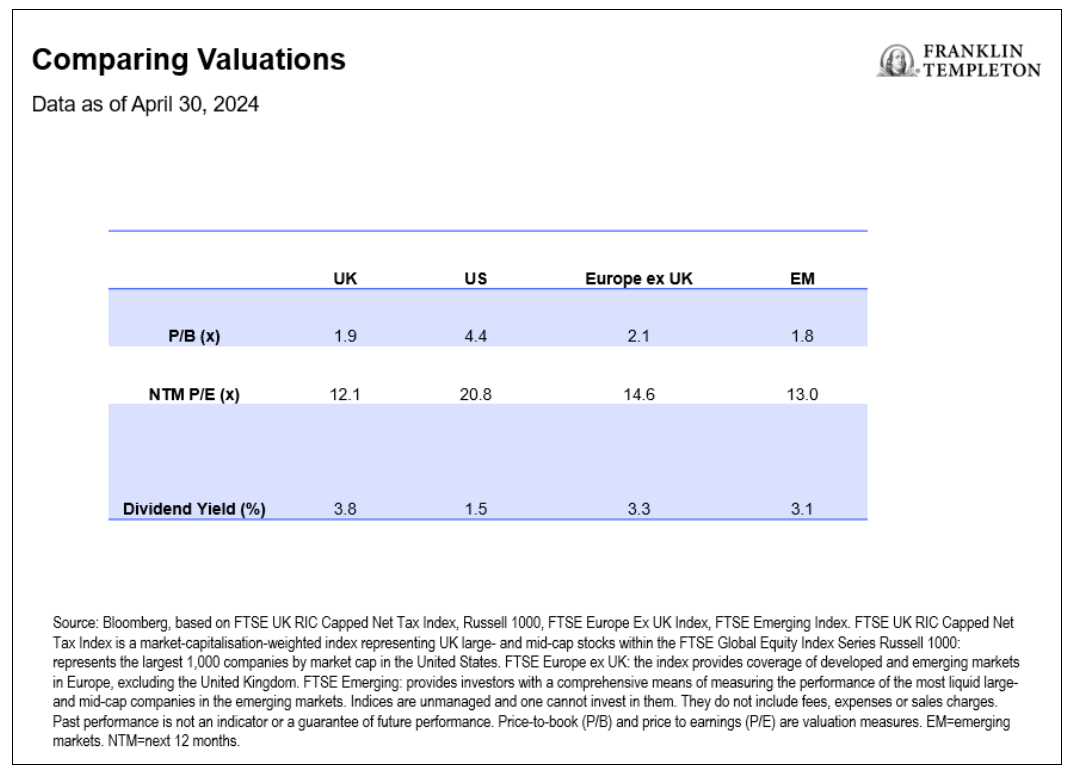
Cheap valuations in a cheap currency have sparked a “frenzy” of merger and acquisition (M&A) activity, according to James Lowen, manager of JOHCM UK Equity Income. Five of his 60 holdings have been approached by bidders this year alone.
There has been a dearth of initial public offerings (IPOs) but if valuations were to surge, British companies might become more confident about going public here.
And if valuations better reflected what public companies are worth, management teams might be less eager to move their listings to the US.
A pickup in IPOs would create a virtuous circle, according to Graham Ashby, a UK all-cap fund manager at Schroders. “History clearly shows that increased UK IPO activity typically corresponds with a short-term peak in the equity market – witness the high levels of IPO activity in 2008 and 2021, compared with current depressed levels,” he said.
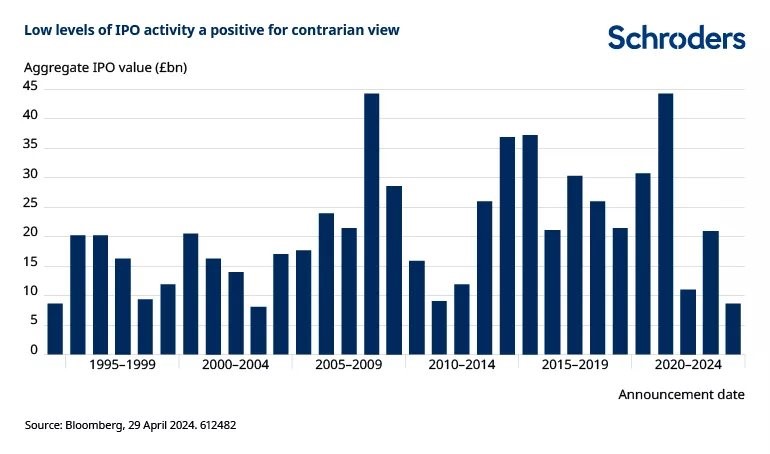
Meanwhile, companies themselves are cognisant of the value in their own cheap shares, so have been buying them back in droves. Buybacks – along with companies being taken out by foreign acquirers or moving their listings abroad – are gradually shrinking the size of the UK equity market.
Ashby observed that “less supply when demand may be set to increase” could eventually drive up prices. Quoting Warren Buffett’s maxim of being greedy when others are fearful, he concluded: “It may be time to get greedy.”
The overall cheapness of the UK market masks the fact that some of the UK’s largest stocks already appear expensive, Lowen warned. The seven “expensive defensives” (AstraZeneca, GSK, Diageo, Unilever, LSEG, British American Tobacco and RELX) look overvalued and comprise a fifth of the FTSE 100, which represents “a big danger lurking under the surface” for passive investors.
Other areas such as banks, insurers, miners and small-caps offer greater opportunities. That is why Lowen believes actively-managed strategies that can deviate away from the FTSE 100 index’s largest names would be a better way to play the UK recovery.
FE fundinfo head of editorial Gary Jackson set out to find the best performing active UK equity managers this week and found 21 funds that beat the mighty MSCI All Country World index over three years.
Five funds even outperformed the MSCI ACWI by more than 5% (Invesco UK Opportunities, BNY Mellon UK Income, UBS UK Equity Income, Invesco FTSE RAFI UK 100 UCITS ETF and Ninety One UK Special Situations).
This is no mean feat, dominated as the global index is by the US, which has outperformed the UK mightily.
If these fund managers can surpass global equities during a period where the UK has been a laggard, what might they be capable of at the helm of a more buoyant opportunity set?
This could be an attractive entry point into the asset class, say experts.
Small-caps have been deeply out of favour in the UK and elsewhere.
Every month over the past year, the size of small-cap equity funds has shrunk by a third, contracting from £14.5bn five year ago to £9.8bn today, according to data from the Investment Association. This shrinkage has been caused by both outflows and disappointing returns, which have averaged at -15% over the past three years.
But with UK economic growth now improving, inflation easing and signals that a rate cut could come as soon as next month, some of this negative sentiment could start to lift, according to Bestinvest managing director Jason Hollands.
He declared: “It could be quite an interesting time to dip the toes back in.”
“Small-cap stocks are inexpensive and another factor to consider is that the whole UK market is basically up for sale to international bidders at the moment, who can see plenty of value opportunities,” he added.
His message was echoed by Sheridan Admans, head of fund selection at TILLIT, who said the expectation that rates have stabilised or will potentially be cut later in the year “has provided a catalyst for rising investor interest”.
FundCalibre managing director Darius McDermott added that today’s cheap valuations, which are unlikely to last over the long term, represent a “good potential entry point”.
For investors who are tempted by these opportunities, below is a selection of domestic and international small-cap funds to consider.
UK small-caps
Hollands went with the River & Mercantile UK Listed Smaller Companies fund and, for investment trust fans, Henderson Smaller Companies.
The former is managed by George Ensor with a focus on the smallest 10% of companies on the UK market.
“The ES River & Mercantile process includes growth, value and recovery buckets, so the fund has performed well in a variety of market environments,” he said.
Henderson Smaller Companies, managed by veteran Neil Hermon, includes exposure to mid-cap stocks in the FTSE 250.
“It has a quality growth approach and will ‘run its winners’, holding on to its winners as [they ascend] into the mid-cap arena. In common with most UK equity investment companies, it is trading at a fairly big discount at the moment, -13%, which should appeal to bargain hunters,” Hollands concluded.
Admans also admires the River and Mercantile fund, but suggested the Aberforth Smaller Companies trust as another option, with its “unique approach” to investing in companies that are out of favour.
“Its focus on turnaround stories or value investing is a refreshing alternative to the more popular growth-focused funds in the market,” he said.
“What sets Aberforth apart is its team-based approach and its emphasis on dividends and a company's ability to pay them.”
Despite its success, the trust is currently trading at an 11.6% discount to its net asset value, presenting “a great opportunity for investors who are looking for exposure to Aberforth’s specific niche of deep value UK small-caps”.
Other picks included Liontrust UK Micro Cap, favoured by Pharon Independent Financial Advisers head of fund solutions Andrew K O’Shea. It has been "successfully managed" on a team approach by Anthony Cross, Julian Fosh, Victoria Stevens and Matt Tonge since its launch in March 2016 and they have more recently been joined by Alex Wedge and Natalie Bell.
The fund is managed using the "Economic Advantage" investment approach that looks to identify companies with a durable competitive advantage by generating – and more importantly, sustaining – a higher-than-average level of profitability.
"Companies that are successful in gaining a place in the portfolio must also have a minimum percentage of the share ownership held by senior management," said O'Shea.
"The fund currently has a bias towards the technology and industrials sectors, which together account for approximately 50% of the portfolio."
McDermott highlighted the IFSL Marlborough UK Micro Cap Growth fund, which has gone through a period of poor performance due to its style being out of favour but “will recover when the wind changes”.
Small-caps overseas
But it’s not just in the UK that smaller companies could come rally from their low valuations. McDermott was also bullish on US and European small-caps, where many world-class, high-quality companies are trading below their intrinsic value.
To tap into a European small-cap recovery, he highlighted Janus Henderson European Smaller Companies.
“Backed by a large and experienced investment team, this is a true stock picker’s fund where the managers are happy to invest across the entire universe to deliver returns,” he said.
For exposure across the board, abrdn Global Smaller Companies is a “textbook global small-cap fund”, said McDermott.
Based around abrdn’s screening tool 'Matrix', which former co-manager Harry Nimmo helped create, it identifies smaller companies from all around the globe, including in emerging markets, that are believed to have the best growth prospects.
Finally, for investors looking for exposure to the largest stock market in the world and one of the most dynamic parts of it, Admans chose the Artemis US Smaller Companies fund.
“The managers take a flexible approach and aren’t wedded to either growth or value but they look for the large companies of tomorrow,” he said.
“As such, there is a slight preference for long-term structural growth sectors like technology and healthcare. The team managing this fund has significant experience and a track record of investing in US small-caps.”
Investment decisions are driven by both macroeconomic views and bottom-up stock picking, he added.

There is more growth in airlines and banks than people think, according to Phoenix Asset Management's Gary Channon.
Airlines and banks aren’t usually thought of as growth areas, but they have the potential to surprise sceptical investors, according to Gary Channon, manager of the £190.7m Aurora Investment Trust.
Although he focuses on valuations, he admitted he has been “obsessing” about the growth potential of these industries.
For banks, the market is assuming a 13-14% return on equity, but the manager predicts they are in a good position to deliver well above consensus expectations.
“What really excites me about banks and airlines is that so many of these companies now have almost-impossible-to-replicate market positions and actually quite good growth prospects,” he said.
Another misconception around these companies is that they are of lower quality, but he disagreed and said their competitive positions are “very strong”.
Performance of fund against sector and index over 5yrs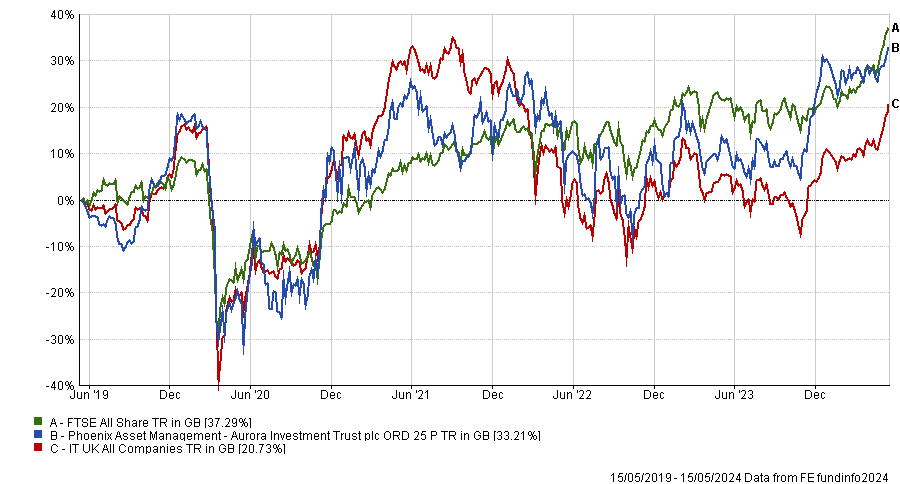
Source: FE Analytics
Banks tend to grow in line with deposit growth and to consolidate their market shares over time, he noted.
“In the past 25 years, deposits have grown about 6% per annum in the UK. If banks grow deposits by 5% or 6%, their earnings growth is going to be 10-15%,” said Channon.
As for airlines, he used Delta as an example, whose revenue growth has been twice that of Procter and Gamble and the same as L'Oreal over the past 25 years, and its competitive position has improved.
The market is substantially underestimating the potential of banks and airlines, said the manager, and what’s even better, these stocks are trading at “incredibly” low multiples.
“The earnings progression is what makes me think that the absolute opportunity here is much bigger than people think,” he concluded.
Channon is not the only one bullish on banks. Hargreaves Lansdown equity analyst Matt Britzman cited four reasons why investors should consider buying the UK’s largest banks: defaults remain low; elevated interest rates are a tailwind; capital levels support strong shareholder returns; and the UK’s economic outlook is improving.
With first-quarter results strong across the board and economic data pointing to clement conditions ahead, banks “have a spring in their step”, Britzman said.
In the same vein, J O Hambro Capital Management’s James Lowen said banks have been one of the best performing parts of his JOHCM UK Equity Income fund during the past year, but he thinks they are still cheap and have further upside. He owns Barclays, Natwest and Standard Chartered.
Channon has chosen Lloyds Banking Group as his fourth-largest position, making up 7.9% of the portfolio.
The Aurora trust also holds include Ryanair and easyJet, which respectively account for 6.8% and 4.4% of its assets under management.
Channon follows a value-based approach to investing in high-quality UK-listed businesses and aims to buy stocks at prices that allow for strong returns.
The gold price has soared recently but there could still be upside if history is anything to go by.
Since late February, the gold price has soared to new heights in nominal terms, trading at 2,349 dollars per troy ounce. There are various contributing factors including anticipated delays to rate cuts following stickier-than-expected inflation; rising geopolitical risks in the Middle East; and a weakening US dollar.
The two biggest drivers, however, appear to have been central bank purchases and algorithmic traders pushing the price up.
Gold’s recent performance indicates improved sentiment towards the metal, although in real terms the price still lags 2020 levels reached during the Covid-19 crisis. Also, if we zoom out on the performance of gold equities, the asset class is trading well below its long-term average, indicating there could still be a reasonable amount of upside from here.
Looking across the spectrum of gold investments, bullion outperformed miners. Gold miners are more closely correlated to equities, which have performed strongly, but only a narrow subset of stocks have led this outperformance and gold miners didn’t form part of that cohort.
Throughout history, gold has acted as a good inflation hedge, evident in the 1970-80s, but more recently in 2020-21 gold struggled to keep up with inflation due to headwinds such as rising bond yields.
In a similar vein, the relationship between the performance of gold and Treasury inflation-protected securities (TIPS) has decoupled over the past few years, with gold significantly outperforming those bonds. Only now, three years on, are we finally starting to see that relationship return.
Over the past few years, gold exchange-traded products have experienced significant outflows, even during the recent rally. However, the metal saw strong demand from central banks during March from countries such as China, Poland and Turkey. Gold as a proportion of foreign reserves remains very low in these countries (just 4% in China) compared with other regions such as the US, which has 70% of its foreign reserves in gold. So we could well see this demand continue.
It’s not new news but it’s worth highlighting that gold is an event risk hedge and a good diversifier in investment portfolios; in times of turmoil investors flock to safe-haven assets, including gold. We’ve observed this time and again in the past: for example, the gold price increased by 17% and 33% during the 9/11 attacks and Paris bombings respectively, whilst equities significantly lagged these figures.
Currently, geopolitical risk remains elevated, with continued conflict in Ukraine and the Middle East and rising tensions between the US and China, and therefore an allocation to gold could make sense.
The quality of gold investments has evolved over time and in 2012 the London Bullion Market Association (LBMA) published its Responsible Gold Guidance (RGG) in order to combat human rights abuse, avoid contributing to conflict and to comply with high standards of anti-money laundering and combat terrorist financing.
More recent guidance goes further and requires refiners to provide an assessment of their environmental, social and corporate governance (ESG) responsibilities. There are various passive vehicles which track the same index but have varying levels of ESG integration. By selecting products that require adherence to more recent LBMA RGGs, investors can achieve the same performance, at the same fee, whilst reducing exposure to the aforementioned risks.
So could it be gold’s time to shine? Well, despite the recent rally there could still be upside if history is anything to go by, and with central banks increasing reserves and geopolitical risks on the rise, there is a clear investment case for holding gold. And there is also the option to invest in exchange-traded funds with reduced exposure to various ESG risks if the appropriate fund is selected.
Jade Coysh is a senior research analyst at Momentum Global Investment Management. The views expressed above should not be taken as investment advice.
The information contained within this website is provided by Web Financial Group, a parent company of Digital Look Ltd. unless otherwise stated. The information is not intended to be advice or a recommendation to buy, sell or hold any of the shares, companies or investment vehicles mentioned, nor is it information meant to be a research recommendation.
This is a solution powered by Digital Look Ltd incorporating their prices, data, news, charts, fundamentals and investor tools on this site. Terms & Conditions. Prices and trades are provided by Web Financial Group and are delayed by at least 15 minutes.
© 2024 Refinitiv, an LSEG business. All rights reserved.
 Please wait...
Barclays Investment Solutions Limited provides wealth and investment products and services (including the Smart Investor investment services) and is authorised and regulated by the Financial Conduct Authority and is a member of the London Stock Exchange and NEX. Registered in England. Registered No. 2752982. Registered Office: 1 Churchill Place, London E14 5HP.
Barclays Bank UK PLC provides banking services to its customers and is authorised by the Prudential Regulation Authority and regulated by the Financial Conduct Authority and the Prudential Regulation Authority (Financial Services Register No. 759676). Registered in England. Registered No. 9740322. Registered Office: 1 Churchill Place, London E14 5HP.