The managers of the UK’s largest equity income fund have profited from Tesco’s share buybacks and believe BHP’s recent bid for Anglo American is a signal of the latent value in the UK stock market.
Trade buyers are circling around UK plc, swooping upon lowly valued assets in a cheap currency. This isn’t an entirely bad thing for the UK stock market because it is evidence of value, which buyers with longer time horizons can see.
Andy Marsh, co-manager of Artemis Income, used Anglo American as an example of a stock where the market has become “somewhat fixated” by short-term performance and ignored the long-term value.
But things are turning around slowly. International investors are appearing on the share registers of specific companies, for example.
It is not just international investors, however. British corporations themselves evidently believe their own shares are cheap and have been buying them back in droves. Tesco’s share buybacks have eaten significantly into its share count and it is far from alone.
At £4.6bn, Artemis Income fund is the largest fund in IA UK Equity Income sector and 60% of the companies in its portfolio by value have bought back shares in the past year.
Trustnet spoke to Marsh and Nick Shenton, who run the fund in tandem with FE fundinfo Alpha Manager Adrian Frost, about executive pay, M&A activity and share buybacks.
Performance of fund vs sector and benchmark since inception
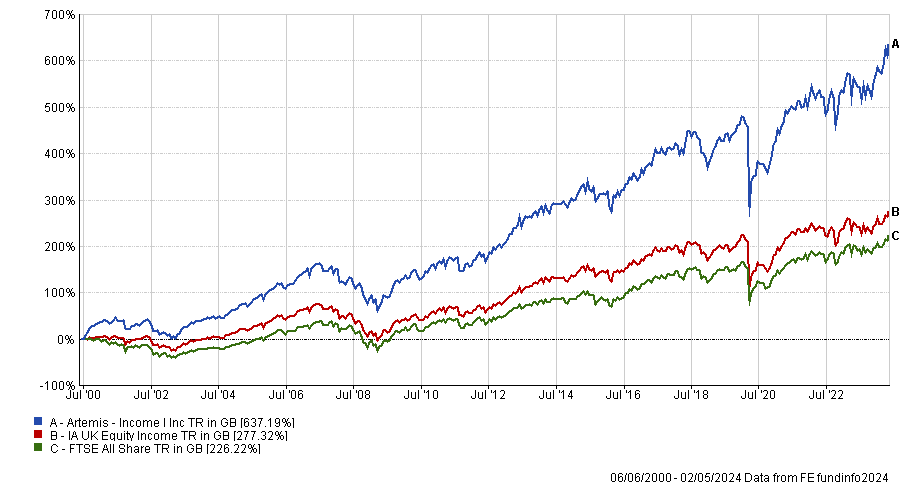
Source: FE Analytics
Please describe your investment process
Marsh: Our mantra is cash flow first, dividends second. We are looking for mispriced long-term cash flows and we’re seeking duration of cash flow. We invest in companies that are creating durable value for all stakeholders, not just shareholders. We have diversification across the fund so as not to be overexposed to any one factor or sector.
Shenton: One example of long duration is Informa, the world’s leading operator of events where industries go to meet, such as the Miami Boat Show or the World of Concrete. When you go to these events and see 50,000 people congregating, you realise this is a strong business which should be around for many years to come because it has unique assets.
Does the size of your fund constrain your investment universe?
Shenton: People were asking that when I joined Artemis in 2012 and we have to prove that’s not the case. We want businesses that are large enough that they’ve got a track record and we can understand them but small enough that they’ve got scope to grow. We don’t go near small-cap.
Marsh: Our sweet spot is in the bottom half of the FTSE 100 and our median market cap is around £8bn. These are companies that are large enough to be relevant, often globally, but not so large they can’t grow. If you look at the FTSE 100, 65% of that index is in the top 20 stocks and we have just north of 20% in those names.
What is your view on the spate of international buyers bidding for British businesses?
Shenton: We think it's a signal of long-term value. Most of the entities bidding for UK companies are trade buyers, so these are people who understand the industry and want to own these assets for a long time. It's not private equity using leverage and looking for an exit within five or six years.
Take Anglo American for example. Until BHP’s bid, people were ignoring the long-term value of its assets, particularly in copper. Then a trade buyer signalled value and the shares rose 15% in two days and people started looking at it in a completely different way.
What have been your best and worst performers over the past year?
Shenton: 3i Group has been a tremendous performer and not just over the past year, although it was up 70% and that's unusual. It has one particularly outstanding asset, the European discount retailer Action.
Marsh: One of our most disappointing performers over the past 12 months has been Dr. Martens. The brand has significant global recognition but relatively low penetration of sales across big markets like the US, Europe and Asia.
What we underappreciated was some of the challenges around executing on that growth potential. We continue to own the shares because we still think the revenue opportunities are there, but its ability to convert that revenue into profits has not been as substantial as we expected.
Have many of your portfolio companies been buying back shares?
Shenton: This is a trend we see across the whole UK market. BP and Shell are gobbling up their own shares and 60% of our portfolio by value bought back shares in the past year.
When companies buy back shares on a very cheap valuation, it can create outsized returns. If you're trading at 5-6x price-to-earnings and paying a mix of dividends and share buybacks, you can eat into your share count very quickly.
An interesting example is Tesco, which trades at a 10% free cash flow yield and a 4% plus dividend yield with the balance of cash being returned to investors through share buybacks. Last year we increased our ownership of Tesco by 5% without lifting a finger, just because of share buybacks.
Are there any themes in the portfolio?
Shenton: Turning the threat from technology into an opportunity is a golden thread that runs through. Several companies were trading at low valuations because investors thought they would be disrupted by technology, but actually, they were able to use technology to become better businesses, learn more about their customers and create value for them.
Pearson fits into that camp. It is the world’s leading assessment and qualifications business and is a disruptor in the market for English language qualifications in India. Pearson gets results back to people within a couple of hours so they know whether they have passed the standard of English test to emigrate to a country such as Canada, whereas competitors take days. Personalisation of learning using artificial intelligence is another huge opportunity for Pearson. It doesn’t look expensively valued. It has a free cash flow yield of over 6% and very limited debt.
Do you incorporate sustainability into the fund?
Shenton: We think there’s a great imperative on active managers to be truly active – to create value with the companies. We engage heavily with our businesses on all matters. They call us directly; they know who to speak to at Artemis. We think it’s really important that we lead as fund managers – with the support of a good stewardship team – because we’re the ones who should understand the opportunities and threats to the business.
What do you enjoy doing outside of fund management?
Marsh: I’ve spent years driving my football-mad boys around the country for matches and I have a son who’s just signed his first professional contract with Crystal Palace.
Shenton: With a group of friends, I set up a sports club 12 years ago. We’re trying to play as many different sports as possible.
There are plenty of logical reasons why investors might want to shift out of stocks but the data tells us not to.
‘Time in the market is better than timing the market’ is an old adage used by financial experts and one that is typically thought to be the best way for new investors to think about how to put their money to work.
The idea of staying invested came up again this week in a blog post from abrdn, in which its Asia Pacific team highlighted the below chart.
It shows how much an investor would have made if they had put $10,000 in the S&P 500 back in 2003 and left it fully invested for 20 years.
By comparison, the chart also shows the returns that same investor would have experienced if he or she had missed the 10 best days in the market or fared even worse.
How much an investor would have made with $10,000 over 20yrs
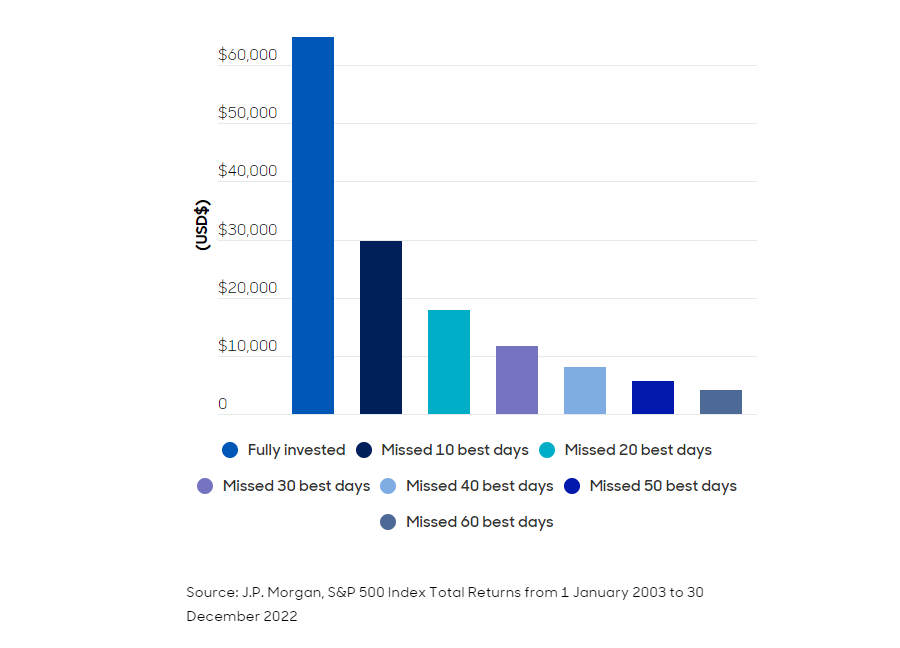
This phenomenon of lowering returns when missing out the best days is particularly compounded for income investors, the research noted, as investors will miss out on dividends throughout any periods their money is not being put to work.
It sounds simple: stay invested throughout and reap the rewards. But there will undoubtedly be some that believe they can do even better – why not try to miss the worst days and still reap the rewards of the best?
The reason this is so difficult to do in practice, however, is because quite often these best days come shortly, or even immediately, after the worst days – making it incredibly hard to time.
Yet it would not come as a surprise if investors have in fact been making changes to their portfolios during the past couple of tumultuous years. Indeed, there are plenty of logical reasons why they might want to consider pulling their money out of stocks.
First, cash and bonds now offer compelling yields for the first time in more than a decade, giving investors the chance to move down the risk scale and still achieve steady returns.
This has been compounded by several big events including Covid-19, war in Europe and the Middle East and – new to 2024 – an array of elections in countries around the world including the UK, US and India. All of these have at times posed significant risks to markets.
Then there are the macroeconomic pressures. Inflation has dropped but the final push to central banks’ 2% target is proving difficult to achieve, leaving interest rates in limbo at present and causing more concern that rates may stay higher for longer – something markets are not favourable on.
Lastly, turning to markets themselves, it is easy to come up with arguments as to why now may be a good time to take profits from expensive US stocks such as Nvidia and the other ‘Magnificent Seven’ names that have dominated for the past 18 months, or the ‘Granolas’ in Europe, which have rocketed in recent years.
An investor looking at any or all of these factors could be forgiven for making changes to their portfolios and shifting exposures, taking profits or selling out entirely.
Despite plenty of reasons to move your money elsewhere, whether it be to take on less risk through bonds and cash options, or to move outside of expensive areas such as the US, the data always reminds us that the best course of action is to stay the course and remain invested.
Trustnet asks experienced equity managers whether they are worried about excessive valuations.
Stock markets around the world have hit all-time highs this year and even though most areas – especially the mighty US – began to cool off last month, worries about irrational exuberance and toppy valuations abound.
Against that backdrop, James Thomson, manager of Rathbone Global Opportunities, expects a “rollercoaster” ride in the coming months as optimistic investor positioning runs into the reality of company results.
“Many investors have already positioned themselves for good news so even when a company beats analysts’ consensus forecasts the stock can still go down. It’s usually the best performers that get hit by profit-taking on this ‘sell the news’ phenomenon,” he explained.
Despite US equities being priced for perfection, Thomson does not think valuations are in bubble territory.
“While many investors recoil at US valuations, we counsel that expensive does not always mean overvalued. In fact, when you assess US valuations in the context of their growth potential, resilience and the protected profile of future growth, we still think the US market provides some of the most attractive opportunities to make money over the long term,” he said.
The US stock market was propelled to giddy heights by the ‘Magnificent Seven’ mega-cap tech stocks last year, when artificial intelligence (AI) was the main game in town, prompting talk of an AI bubble. That dynamic is starting to unwind this year, with some of the seven, most notably Tesla and Apple, slipping from their perch.
Terry Smith, manager of Fundsmith Equity, said: “The most obvious areas for worry are the stocks which have been driven by the AI hype. We have yet to see any clear revenue models for generative AI let alone a clear path to profits and returns on the considerable investments.”
Smith is also concerned about the prospects of further rate hikes from the US Federal Reserve and the chaos that might unleash in financial markets.
JPMorgan boss Jamie Dimon said in his annual letter to shareholders last month that the bank was preparing for interest rates to be anywhere between 2% and 8% or even higher. Persistent inflationary pressures and high government spending could compel the Fed to hike rates, he suggested.
Smith warned: “If Jamie Dimon were to be proved right about the risk of rate rises driven by the US budget deficit and the end of quantitative easing, then we could see a more general sell-off in anything highly rated, like we did in 2022.”
The future is by no means bright or certain, therefore. In fact, according to Thomson, “global equity markets are suffering from a scarcity of certainty”.
“I think investment returns will be lower in the years ahead and more inconsistent, but that doesn’t mean you shouldn’t invest,” he added.
Rathbones is staying balanced across a variety of sectors. “We think nimble stock-picking amongst industry champions and overlooked growth stocks should provide significant outperformance for our active approach – albeit with the chance of increased short-term volatility,” Thomson explained.
For Wellington Management, a rollercoaster ride in global equity markets is nothing to be scared of and indeed, short-term volatility provides a chance to rebalance the portfolio.
Yolanda Courtines, who manages Wellington Global Stewards, said: “Market volatility presents opportunities for us to trim our outperforming positions with expanding valuation multiples and lean into companies where the valuation has been compressed.
“This construction philosophy was particularly effective in 2022 when we leaned into positions within financials where valuations multiples had fallen through 2021. The portfolio then significantly outperformed in 2022, partly driven by the financials businesses which benefited from the rising rate environment and the market reengaging with the stocks.”
Courtines and co-manager Mark Mandel aim to hold companies for 10 years or more so the current market environment does not influence whether they buy or sell a stock. Instead, they look for companies with a high return on capital and strong stewardship credentials.
“Our holdings typically have robust balance sheets, world-class management, engaged boards, a long-term orientation, proven capital allocation skill and a stakeholder mindset,” she said.
Like Wellington, GQG Partners focuses on bottom-up stock picking and looks beyond the present macroeconomic backdrop. Therefore Rajiv Jain, Brian Kersmanc and Sudarshan Murthy, who manage the GQG Partners Global Equity fund, said they are not concerned about bubbles in the equity market.
“We employ an adaptable process that is not incumbent upon strong performance in certain sectors, countries or factors for us to outperform,” they said.
The firm’s philosophy is to own a concentrated portfolio of high-quality businesses at reasonable prices that exhibit high visibility on earnings and potential headroom for growth over the next three to five years.
GQG’s global equity fund is overweight select companies within the technology, communication services and energy sectors. Recently, Jain, Kersmanc and Murthy have also been investing in utilities.
Thomson, Smith, Courtines, Mandel and the GQG trio have all been nominated for the FE fundinfo Alpha Manager awards in the global equity category, alongside Royal London Asset Management’s Mike Fox. The winner will be announced on 14 May 2024.
Riddell will become the lead portfolio manager of Fidelity's total return bond strategies by January 2025 at the latest.
Fixed income manager Mike Riddell has left Allianz Global Investors and the flagship Allianz Strategic Bond fund to join Fidelity International in August.
He will become the lead portfolio manager of Fidelity’s total return bond strategies, as well as the £370.6m Fidelity Strategic Bond fund, by 2 January 2025 at the latest. The fund’s current manager, Tim Foster, will assume co-portfolio manager responsibilities.
Since its peak in assets under management in May 2021, when it reached £1bn, the Fidelity Strategic Bond fund has shrunk to the current size, lagging the IA Sterling Strategic Bond sector and returning 0% in the past five years, as the chart below shows.
Performance of fund against sector over 5yrs
 Source: FE Analytics
Riddell’s experience in fixed income markets stretches back 22 years. He joined AllianzGI in 2015 as a senior portfolio manager and previously worked at M&G Investments for 12 years, where he managed index-linked and government bond funds.
Steve Ellis, global chief investment officer, fixed income at Fidelity, said Riddell has a strong long-term track record and “a philosophy centred on providing low correlation to equity in total return and unconstrained fixed income strategies”.
“We are confident that his top-down macro insights will enhance and complement our extensive bottom-up credit and quantitative research resources,” he added.
Riddell has managed the Allianz Strategic Bond fund since 2015. It had a phenomenal year in 2020, returning 31% versus 6.6% for the average fund in the IA Sterling Strategic Bond Sector. However, it has lagged the peer group average since then.
Performance of funds versus sector over 5yrs

Source: FE Analytics
Riddell said: “I am greatly looking forward to taking full advantage of Fidelity’s strength and depth to add further rigor to the investment process, portfolio construction and especially risk management and oversight, which should all help to benefit client outcomes.”
The wealth manager is switching to global funds.
Wealth management firm Coutts (part of NatWest) is pulling £2bn out of the UK equity market as it shifts from a home bias to a global approach.
The King’s bank, which has served the royal family since the time of George IV, is revamping the asset allocation of its six Personal Portfolio funds by cutting exposure to UK stocks and UK investment-grade bonds. It is also introducing a new benchmark, the MSCI All Countries World Index ESG Screened Select Index.
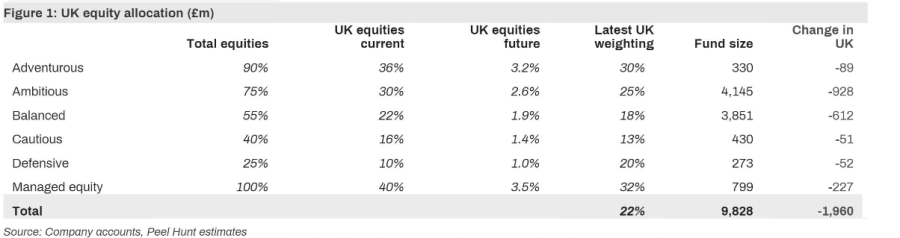
Coutts said it aims to improve diversification as well as long-term returns, but this adjustment will reduce the weight of UK equities from 33% to a mere 2%.
As such, the wealth management firm is poised to sell £1.96bn worth of UK equities, which represents 0.08% of the overall UK market. While it is a small amount, investment bank Peel Hunt warned that it is “very material” in the context of UK outflows.
Allocations to UK equities in Coutts' portfolios
According to figures from Calastone, outflows from UK equities reached £8bn in 2023 and this trend has persisted into 2024.
UK funds suffered net retail outflows of £1.3bn in the first quarter of this year, the Investment Association revealed.
In March alone, British investors withdrew £823m from their domestic equity market, Calastone found. This marked the 34th consecutive month of net selling for UK equity funds.
Charles Hall, head of research at Peel Hunt, said: “This news from Coutts represents a material increase in outflows in the short term. This will inevitably put further selling pressure on the UK market at a time when valuations are already depressed.”
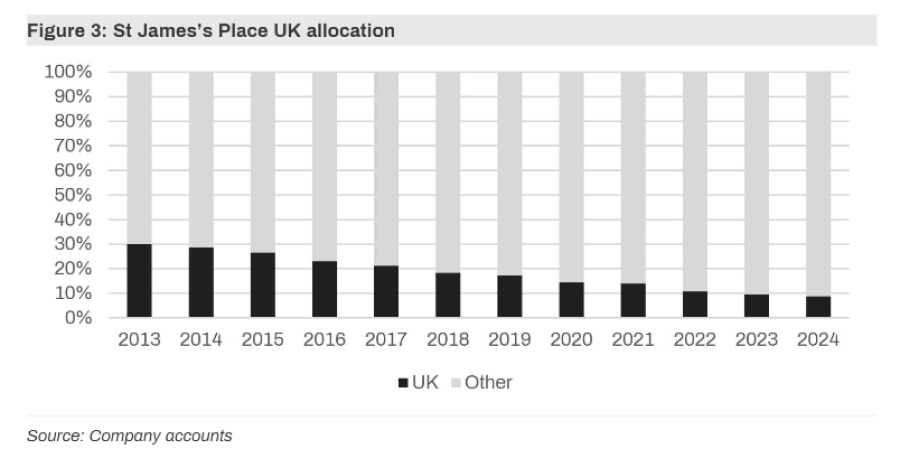
The globalisation dynamic in wealth management portfolios is not exclusive to Coutts; it has been a consistent theme across the industry for the past decade.
For instance, St. James's Place's assets under management (AUM) have surged from £44bn to £179bn since 2013. However, the level of assets held in UK equities has barely changed over the past 10 years. As a result, St. James's Place's allocation to UK equities has fallen from 30% in 2013 to 9% today.
Hall noted that UK retail investors are also abandoning their domestic equity market. On investment platform Hargreaves Lansdown, the total of UK equities, UK equity income and UK small- and mid-sized companies funds fell from 50% in 2015 to approximately 30% at the end of 2023.

As a result, Peel Hunt has urged the government to take action to encourage investors to buy British. The investment bank suggested pension reforms, a British ISA and the removal of stamp duty to incentivise UK investors to return to their home market.
Hall concluded: “If we do not have policies that encourage UK investment, then it is not surprising that there are outflows from the UK and that UK companies underperform.”
Laith Khalaf, head of investment analysis at AJ Bell, was sceptical about how much of an impact a British ISA can make, however. “A wildly unrealistic hope would be that the UK ISA creates an additional £4bn of inflows into UK equities every year. Currently UK equity funds are seeing withdrawals of that order every quarter,” he said.
“Active fund managers plying their trade in UK equities might well be weighing up some mid-life retraining opportunities.”
Sarasin & Partners expects global equities to return 7.7% per annum over the next seven to 10 years. UK equities and gilts are forecast to generate 6.7% and 3.8% p.a., respectively, during this period.
In the past few years, investors have been confronted with one of the most aggressive bouts of inflation seen in decades. The effects of this were amplified by the falls seen in both equity and bond markets in 2022. While there has been a strong recovery in portfolio values over the past year, questions remain as to what the future holds.
To answer some of these questions, we believe it is important to consider how portfolios have historically behaved in such market environments and how these patterns may be applied to future projections.
History favours the patient
Given the surge in inflation experienced during 2021-23, we have specifically reviewed how our multi-asset approach has performed following periods when inflation outpaced the absolute return. The results make for heartening reading, showing a general trend of rebounds in performance.
We found that following a period of negative real returns, investors in the Endowment Model, an investment strategy used by our charity clients, experienced average real returns of 5.6% per annum (p.a.) over the next five years. However, particularly sharp losses (-10% p.a.) have typically been followed by even stronger real returns of 6.6% p.a. over the next five years.
Analysis shows that perhaps the worst decision for many investors would have been to sell in the depths of a market decline and then miss out on the subsequent recovery. If history serves as a guide, investors in multi-asset strategies are likely to experience a rebound in returns, as seen in 2023 and in the first quarter of this year.
The fundamentals that drive projected returns
While the past offers helpful lessons, the key driver of our market projections is the prevailing economic environment and how we expect it to shape investment markets.
Over the long term, returns from equities are driven by the rate at which capital is returned to shareholders through dividends and buybacks, which is ultimately a function of earnings and economic growth.
Over the near term, we expect GDP to grow a little quicker as inflation begins to recede and interest rates are lowered. Growth is likely to decline gradually thereafter, as the working-age population grows at a slower rate. This sets the tone for expected investment returns over the next seven to 10 years.
UK equities and gilts are expected to generate 6.7% and 3.8% p.a. respectively during this period. These returns are lower than the historical average since 1900, as UK equities and gilts have typically generated 9% p.a. and 5% p.a. respectively.
However, we are also expecting inflation to be lower (circa 2.3% p.a.) than the average since 1900 (3.8% p.a.) This is positive for investors’ spending power.
Our projected return for global equities is 7.7%. Once we account for the expected level of UK inflation, this translates into a real return of 5.3%, which exceeds the long-term average of 5%.
Having experienced over a decade of low bond yields, the projected return from gilts is now 3.8%, which equates to a return of 1.5% after inflation. Real returns from corporate bonds appear more encouraging at 2.9% p.a.
What could materially change our outlook?
Forecasting the global economy 10 years from here is complex, as is assessing the implications for multi-asset investment returns. Many things could change, but two particularly merit our attention. These are the rapid advances we are witnessing in technology and the transition to net zero, both of which could have major implications for productivity.
Unlike slow-burning demographic trends, the effect of technology on productivity growth is harder to predict. Technological change can be sporadic, rapid and disruptive – as well as a significant investment opportunity. Two of its biggest drivers are economic necessity (for example due to scarcity of labour, energy, resources or capital) and major threats (such as pandemics, conflict and climate change). These are already very evident in today’s world.
Real improvement comes when a technological breakthrough not only allows an economy to overcome cost increases, but also achieve higher production levels than before the cost pressure occurred. The rapid development of generative artificial intelligence may prove to be an example of this. And despite adding to inflationary pressures and social and political strife, climate change and the transition to net zero economies could be another.
If the historic trend of outperformance following periods of weak real returns does repeat itself, then investors may benefit even further with such advancements.
The views expressed above should not be taken as investment advice. James Hutton is a partner and Kamran Miah is a senior associate partner at Sarasin & Partners.
The Federal Reserve might not cut rates at all this year, but markets will be fine nonetheless, the firm’s economist argues.
Since the US Federal Reserve’s pivot late last year, the market has been anticipating rate cuts – the question being when, not if, the Fed will make its first move. Until recently, four cuts were priced in for this year.
That assumption, however, is being increasingly challenged – to the consternation of investors who have been eagerly awaiting a U-turn.
Darrell Spence, economist at Capital Group, said that if the Fed doesn’t cut rates before year’s end, “this may sound akin to cancelling Christmas” for some investors.
However, given higher-than-expected inflation, “there is a strong chance we will get no rate cuts at all this year”.
He gave three main reasons for why he expects the Fed to demur: US economic strength, inflation and the resilience of financial markets.
First reason: The US economy can handle it
This week, the Fed announced it is keeping rates within a range of 5.25% to 5.5%, its highest level in more than 20 years.
And yet last week, the International Monetary Fund raised its forecast for US economic growth to 2.7% on an annualised basis, compared to 0.8% for Europe and 0.9% for Japan.
“The US economy appears to have adjusted quite well to a higher interest rate environment. Its resilience in the face of much higher interest rates has been one of the biggest surprises of the past two years,” said Spence.
“This type of solid growth is not normally associated with rate cuts. Given this resilience, there is reason to worry that the US economy could overheat if the Fed lowers rates prematurely, which could reignite inflationary pressures.”
Second reason: Inflation is stubbornly sticking around
US prices have fallen from the highs of June 2022, but the Consumer Price Index for All Urban Consumers still rose 3.5% over the last 12 months. Going that final mile to reach the central bank’s 2% target could be the toughest part of the journey, according to Spence.
“One might think inflation in the range of 2.5% to 3% is close enough, but the Fed has repeatedly stressed the importance of that 2% goal. We should assume that 40 or 50 basis points above target is too high,” he said.
“If the Fed does not cut this year, it will likely be because inflation is not falling as quickly as anticipated by central bank officials. That is a likely scenario.”
Third reason: Financial markets are fine with the status quo
US and international stock markets hit a series of record highs in the first quarter of 2024. According to the Capital Group economist, stocks have been able to overcome the fear that higher interest rates would kill the bull market.
“Markets can react violently at the beginning of a rate-hiking campaign, as we saw in 2022, but once we reach a new level of stability, they have often been able to resume their long-term growth trajectory – influenced more by corporate earnings and economic growth than monetary policy,” Spence said.
What should investors make of all this?
Spence sought to reassure investors that low rates are not necessary for markets to thrive.
“If the Fed decides to stand firm, it is not necessarily a bad outcome,” he pointed out.
“Fed officials want to cut rates, but as investors, we need to question that assumption and consider the possibility that, in light of recent healthy growth, maybe Fed policy is not restrictive.
“Maybe that’s why we haven’t had a recession. And maybe that’s why we won’t get a rate cut in 2024,” said the economist.
“Rather than being a negative, however, the absence of a rate cut this year could simply reflect the fact that the US economy is doing quite well.”
History suggests this could be a good time to remain invested in both equities and credit-oriented fixed income, provided that investors are willing to take a long-term view, he added.
The veteran manager will depart next month to pursue an opportunity elsewhere.
Mike Riddell will be leaving Allianz Global Investors in June, giving up the leadership of the Allianz Strategic Bond fund he has been managing since 2015.
AllianzGI confirmed he will be pursuing an opportunity elsewhere from July and Riddell hinted at an announcement planned in the coming days.
The flagship bond strategy will be managed henceforth by the firm’s global markets team, led by core fixed income chief investment officer Julian Le Beron. While the investment objectives, strategy design and guidelines of the strategies will be the same, the investment process will be "enhanced".
The new team-based and co-lead structure “will bring the vehicle in line with the rest of AllianzGI’s wider €170bn fixed income platform,” the firm stated, "and the strategy will benefit from the full risk management oversight and governance processes of the wider AllianzGI fixed income platform."
Under Riddell’s tenure, the fund has ebbed and flowed, with great success during the Covid pandemic, followed by substantial losses and asset outflows more recently. Since May 2021, it shrunk from £3.2bn to the present £924m.
Performance of fund against sector and index over 12 months and 5yrs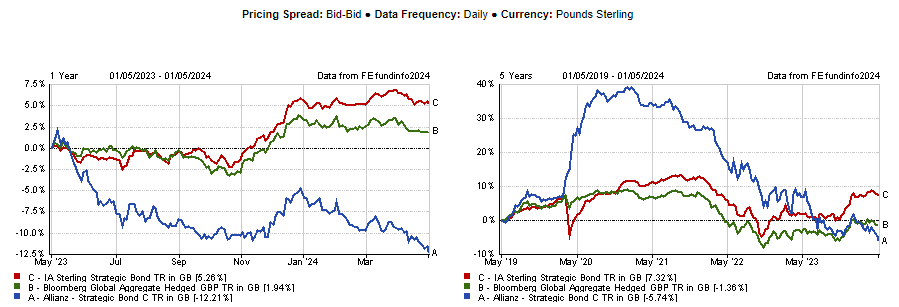
Source: FE Analytics
April was a risk-off month but a few parts of the market made positive returns.
Investors lost money in almost every part of the market in April, data from FE fundinfo shows, with the UK and some emerging markets being among the few highlights.
Below, Trustnet looks at the performance of global markets from multiple viewpoints to see where the biggest losses – and the handful of gains – were made last month.
Performance of asset classes in Apr 2024
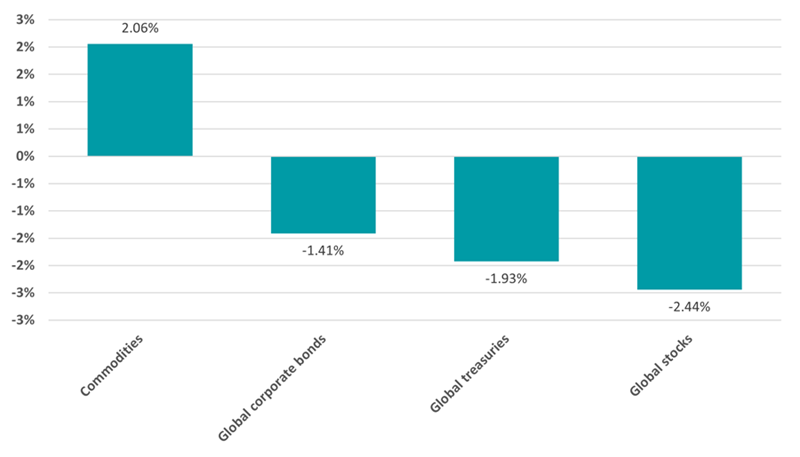
Source: FinXL
Starting with asset classes, global equities fell 2.4% over the course of the month – ending a winning streak that had seen them rally more than 9% in the opening quarter of 2024. The decline has been partly attributed to concerns that the Federal Reverse will not cut interest rates as expected, following signs that US inflation is stickier than thought.
Worries about interest rates were also reflected in falling bond prices during April, with both the global government and corporate bond indices declining. The broad commodities index, on the other hand, climbed.
Performance of investment factors in Apr 2024
20240501_april_in_charts_2
Source: FinXL
There was also a turnaround in the investment factors that led the market. While small-cap stocks continued to struggle in April, the momentum style went from being the first quarter’s best performers (rising 22% in Q1) to shedding 3% last month. Meanwhile, growth stocks underperformed value.
Over the course of the first quarter, there had been warnings that strong momentum rallies often end in painful corrections. While the momentum style is some way off being in correction territory, market commentators have pointed out that investors could continue to be wary of stocks that are trading on lofty valuations while uncertainty persists over interest rates.
Performance by country in Apr 2024
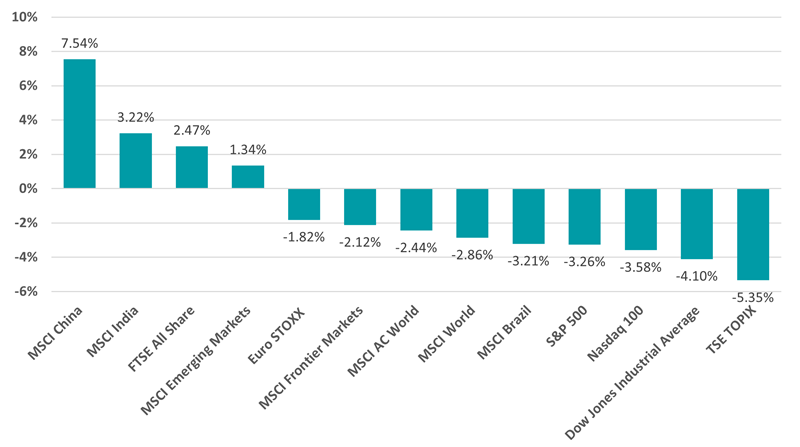
Source: FinXL
On a geographical basis, the likes of Japan and the US – which had been the top performers previously – were hit with the heaviest losses. China and India rallied hard, boosting the broader emerging markets index, while the UK posted positive returns as investors favoured more value areas of the market and remained positive on the prospect for the Bank of England to cut rates.
Performance of equity sectors in Apr 2024
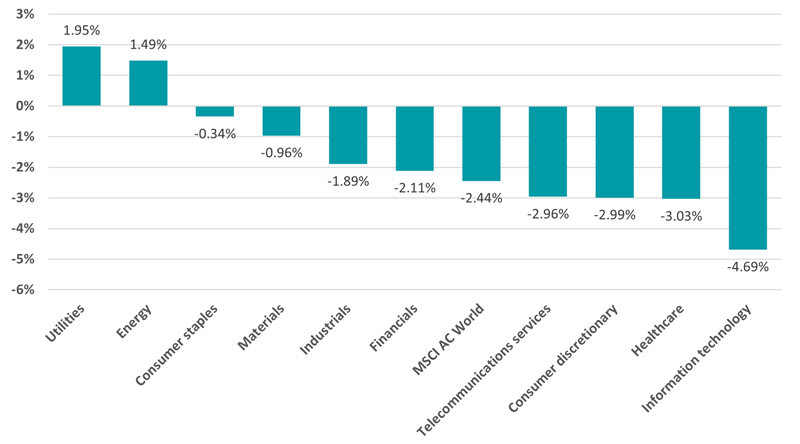
Source: FinXL
With the momentum trade faltering, it should be no surprise to see that the global information technology sector made the biggest loss in April. US large-cap tech stocks regained their status as the market’s darlings recently after investors bet big on artificial intelligence but slipped amid interest rate worries.
Utilities and energy were the only parts of the market where positive returns were made.
Performance of thematics in Apr 2024
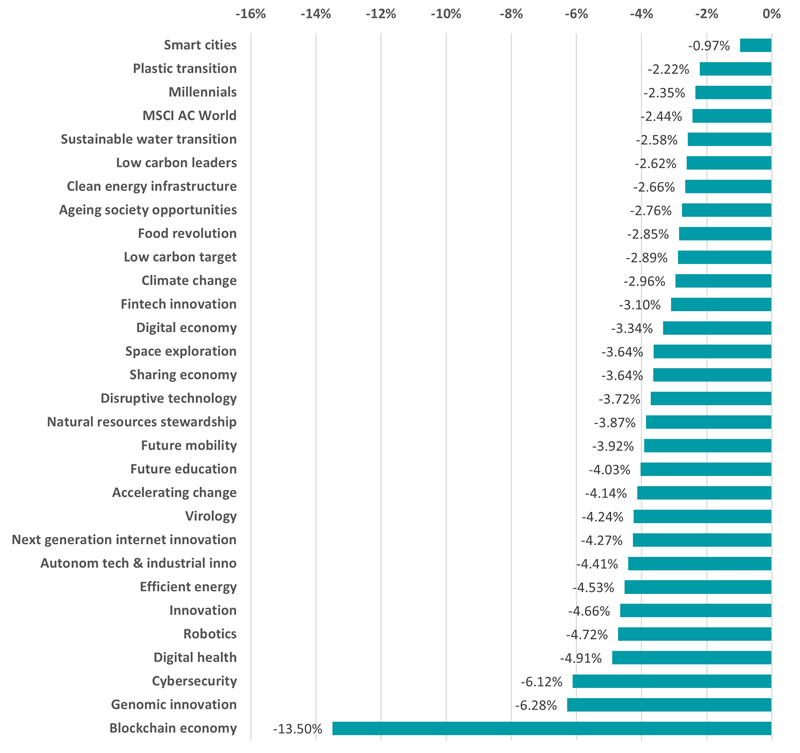
Source: FinXL
April’s aversion to technology and growth stocks meant that every thematic index lost money. Stocks linked to the smart cities theme fared best as this area fell less than 1% but the blockchain economy theme tanked, with its index shedding 13.5%.
Performance of commodities in Apr 2024

Source: FinXL
As the chart above shows, many commodities rose in price last month with zinc leading the pack. Industrial metals such as zinc, copper, nickel, aluminium and lead are rising on the back of growing demand from China and supply constraints from miners.
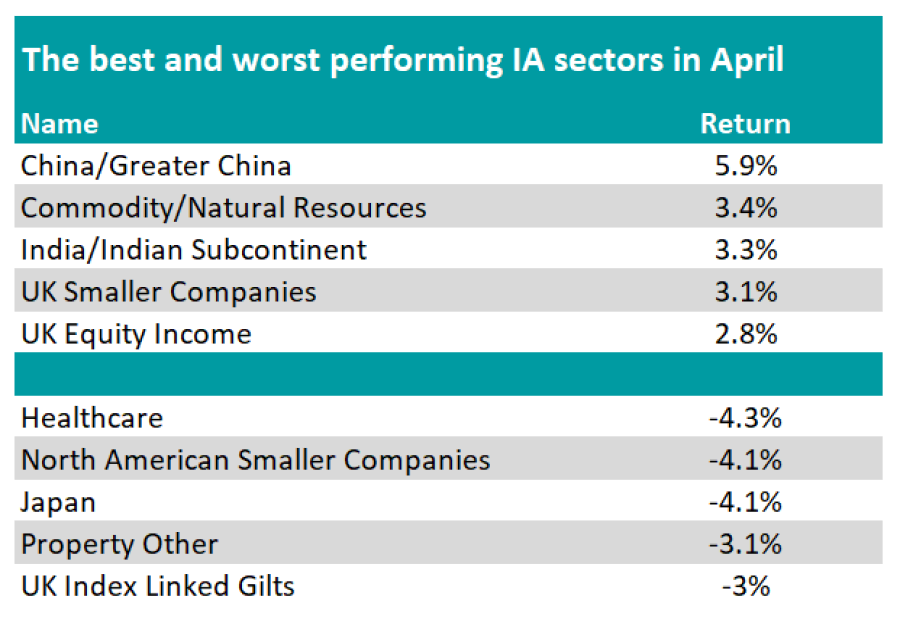
Performance of Investment Association sectors in Apr 2024
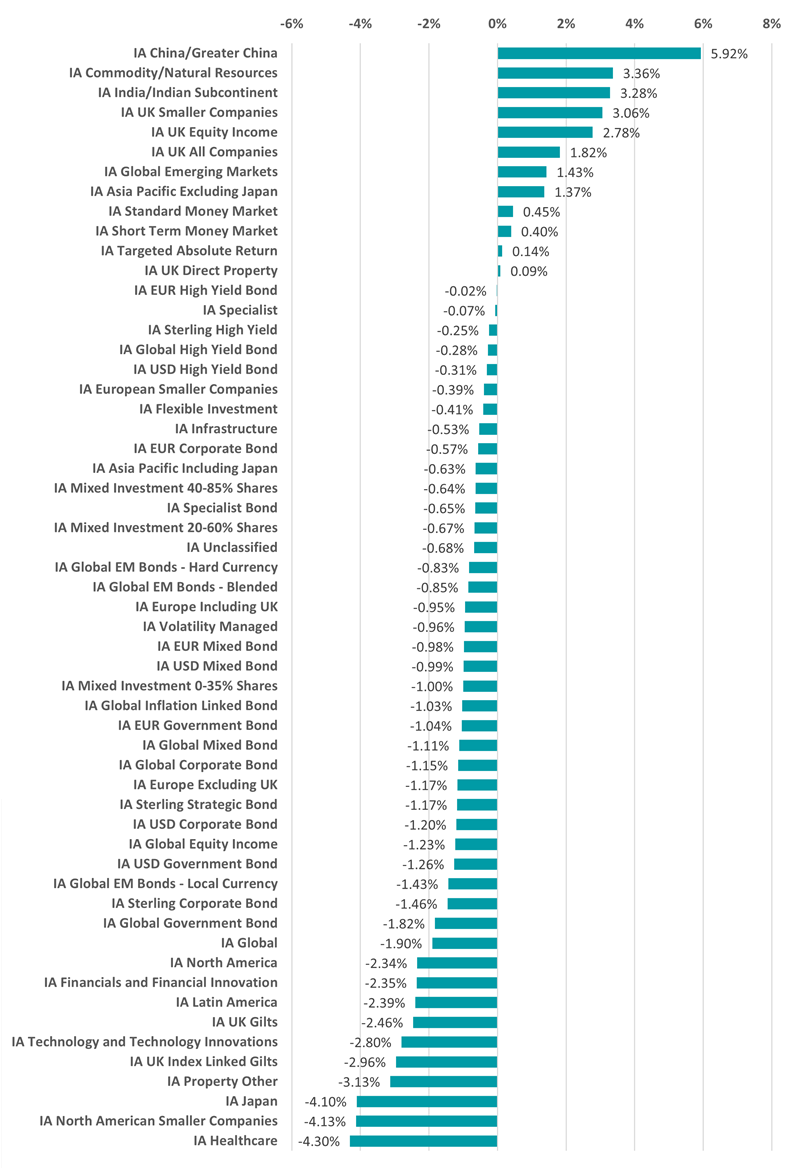
Source: FinXL
Given all of the above, it’s clear why the best performing Investment Association sectors last month were IA China/Greater China, IA Commodity/Natural Resources and IA India/Indian Subcontinent. The three UK equity sectors followed close behind.
Performance of UK equity market in Apr 2024
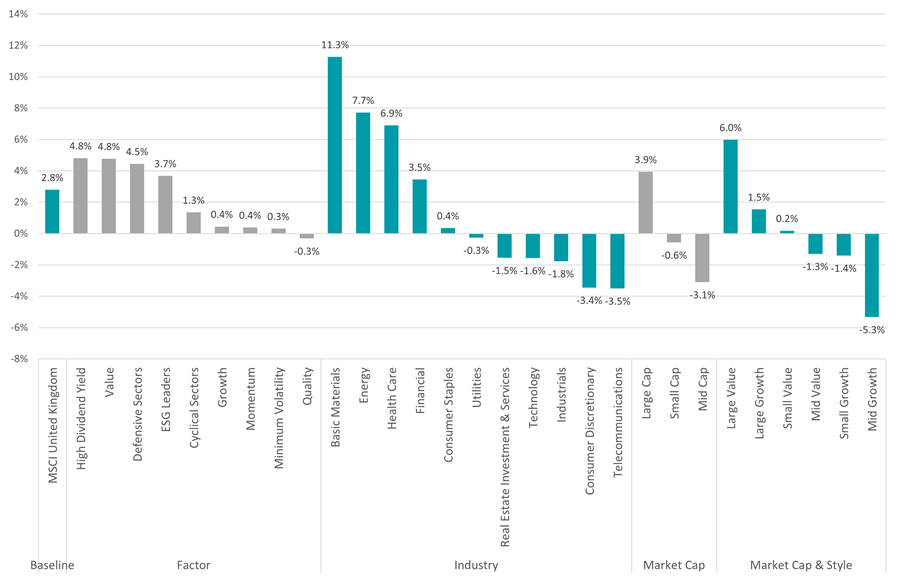
Source: FinXL
With the UK being notable for its performance in April, the above chart goes into more detail about what drove the domestic market.
High dividend and value stocks were the best performers and outpaced the growth and momentum parts of the market by a significant margin. Some of the UK market’s dominant sectors such as basic materials and energy are home to these kinds of stocks, meaning the UK benefitted from investors turned away from growth areas like tech stocks.
William Ayres, Fifo Afaf, Emilia Beck-Friis and Ben Fitchew aim to use behavioural psychology to outperform the stock market.
Four fund managers from defunct firm Ardevora Asset Management have embarked on their own venture called Heuristik Capital.
Ben Fitchew, William Ayres, Fifo Afaf and Emilia Beck-Friis will launch a long-only fund investing in “unusual, high-quality” companies they believe can “surprise” both sell side analysts and investors over the long term.
To achieve this goal, they intend to apply behavioural psychology in their investment process.
Beck-Friis said: “We have a passion for psychology and understanding how people make decisions under uncertainty. Our novel investment process is borne of the behavioural toolkit of Daniel Kahneman and Amos Tversky and the academic literature around bias in markets.”
Kahneman sadly passed away recently and is best known for his book, ‘Thinking, Fast and Slow’. Tversky was his long-time collaborator and together they developed Prospect Theory, which involves behavioural economics, judgment and decision making.
At Heuristik Capital, the four portfolio managers will focus on cognitive psychology in markets, especially those that lead certain actors to try to establish forecasts.
As the firm’s LinkedIn profile explained: “We don’t think it is possible to predict the future with any meaningful degree of precision. As far as we can tell, no one is very good at it.
“We prefer to play a different game. We study the mistakes of those who make a living trying to forecast a company’s future – sell-side analysts. We are particularly interested in persistent error patterns that indicate bias. We spend our time understanding the business models and conditions that lead to bias.”
Ardevora Asset Management shut down earlier this year after its asset under management fell from £10bn at the end of 2021 to £1.4bn at the end of 2023.
The company ran five open-ended funds – four global equity strategies and one UK equity portfolio – and managed a range of segregated mandates for third parties.
Ardevora was established in 2010 by Jeremy Lang and William Pattisson, who made their name at Liontrust Asset Management. Fitchew worked with the duo at Liontrust from 2002 onwards before joining them at Ardevora.
Experts delve into why the fund has lagged its benchmark in recent years and whether investors should stick with it, sell or top up their exposures.
No-one can outperform all the time. Even the most experienced fund managers go through periods when their investment style is out of favour. They have to dig deep and stick to their knitting throughout challenging years and appeal to their investors to keep the faith, before hopefully reaping rewards when their portfolios swing back into favour and the benefits of their experience can be brought to bear.
This is something FE fundinfo Alpha Manager Nick Train and his WS Lindsell Train UK Equity fund are enduring at the moment.
The UK equity fund has rewarded investors with returns far in excess of the FTSE All Share since he launched it in 2006.
However, the £3.8bn fund has been going through a rough patch in recent years. Indeed, Train’s UK equity portfolio has lagged its benchmark in each of the past three calendar years.
Adding salt to the wound, the fund has not participated so far in the recent strong resurgence of the UK equity market and is down 1.5% year-to-date.
As a result, investors may be losing patience and ponder whether WS Lindsell Train UK Equity still deserves a place in their portfolio. Therefore, Trustnet asked experts why the fund has underperformed and what investors should do next.
Performance of fund over 3yrs and 10yrs vs sector and benchmark
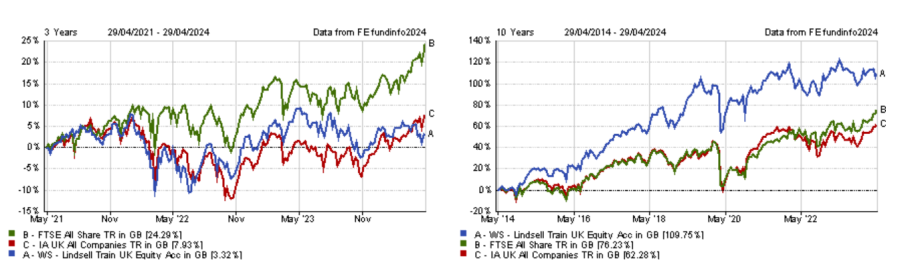
Source: FE Analytics
Why has the fund struggled in recent years?
A peculiarity of WS Lindsell Train UK Equity is that it bears little resemblance to the FTSE All Share.
While the UK index is known for its exposure to value stocks in the energy, mining and financials sectors, Train’s process has more of a quality-growth bias, with an emphasis on companies boasting high return on equity and low capital intensity.
Jason Hollands, managing director at Bestinvest, said: “A key contributor to the period of underperformance is that the fund’s process leads it to owning strong brand franchises, with high weightings to consumer goods, as well as healthcare and business software.
“The fund does not hold companies that are highly sensitive to macro factors, and which have limited control over their pricing, and this means it has had zero exposure to the energy sector, which rallied significantly as economies reopened from the pandemic and on the back of the war in Ukraine.”
Another specificity of the fund is its high concentration, with the top 10 holdings accounting for 81.6% of the portfolio.
Therefore, the fund is highly dependent on the fate of a few key holdings. In the past, this enabled Train to comfortably beat the benchmark, but it has turned into a headwind in recent years.
Rob Morgan, chief investment analyst at Charles Stanley, said: “Having thrived in the low interest rate post-financial crisis era, when the market rewarded his ability to identify resilient growing businesses with long-term cash flows, Train’s style has been less well-suited to the more recent environment of higher inflation and interest rates.
“Good quality companies with steady but unexciting growth have suffered in the same way as bonds as interest rates have risen. In addition, some individual stock picks have detracted, and as the fund is very concentrated this has had a more significant effect than it would have done with a more diverse portfolio.”
Buy, hold or fold?
For Darius McDermott, managing director of FundCalibre, the question investors should ask themselves before taking any course of action is whether they believe UK value stocks will continue to outperform or not.
“If you do, this fund is not for you,” he said.
“But if you believe in the long-term quality compounding way of investing, this fund has an excellent long-term track record and would be a buy.”
Gavin Haynes, co-founder of Fairview Investing, suggested current investors should hold, citing the fund’s focus on data/analytics, software and luxury/premium consumer brands as reasons to keep faith in the fund’s prospects.
He also praised the high level of conviction, which is something he “wants to see” in active management.
Although WS Lindsell Train UK Equity recently landed in Bestinvest’s Spot the Dog report, Hollands also believes investors should stick with the fund, as its process and philosophy have delivered for investors over the long-term and “there is no reason to believe that it won’t prove successful in the future”.
He added: “I think the underperformance of recent years is largely down to the manager’s style being out of step with recent market leadership, not errors of judgement. Investors should keep faith in the fund.”
Morgan went one stage further and suggested increasing exposure to the fund ahead of prospective better times for Train’s style.
He said: “An environment of subsiding inflation and lower interest rates should suit it, but ultimately the manager’s stock picking will be highly influential on performance given the concentrated nature of the portfolio.”
However, Morgan stressed his preference for Finsbury Growth & Income – the investment trust version of WS Lindsell Train UK Equity – as it is trading on an 8% discount, which is outside of the board’s target of 5%. Therefore, share buybacks aiming at closing the gap may offer investors a small performance edge.
“More importantly, the investment trust structure is the optimal way of investing in a Nick Train portfolio owing to his concentrated and low turnover approach. With a fixed pool of capital, the trust isn’t under as much negative flow pressures that have hit UK open-ended funds necessitating managers to offload stocks,” Morgan concluded.
More than 30 investment trusts are offering yields above 4% but investors should take a closer look at how that income is generated before piling in, experts warn.
Income-seeking investors can find rich pickings amongst the investment trust sector, with many trusts offering yields above government bonds plus the prospect of capital gains and an extra kicker if discounts narrow.
Wealth manager Stifel found that 32 trusts investing primarily in equities have a yield of 4% or more and a market capitalisation above £100m. This compares to yields of 4.5% and 4.4% from two-year and 10-year gilts, respectively.
The highest-yielding equity investment companies
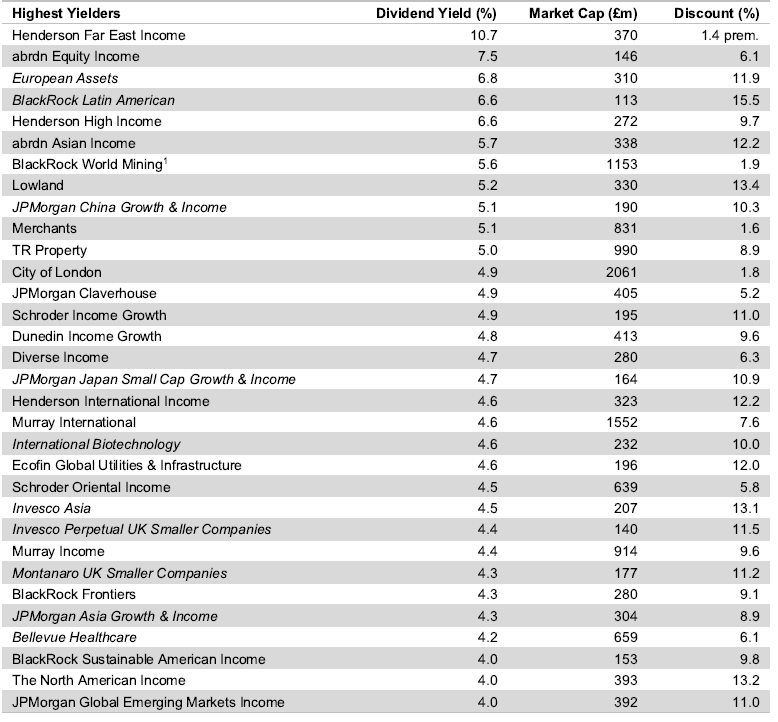
Sources: Stifel, Datastream as at 29 Apr 2024
Almost all of the trusts on Stifel’s list have increased their dividends in the past year as revenues from their underlying equity portfolios have grown, the exception being BlackRock World Mining.
Iain Scouller, managing director, investment funds at Stifel, said: “For those investors prepared to take equity risk, we think the yields on these trusts are relatively attractive.”
Before diving in, experts cautioned investors to research why yields are high in the first place.
Shavar Halberstadt, an equity research analyst at Winterflood Investment Trusts, said: “There is nothing wrong with investing in a trust because of its yield, but we encourage investors to assess whether this is share price-driven, enhanced by leverage or intrinsic, and which profile best suits their risk appetite.”
Edward Allen, private client investment director at Tyndall Investment Management, agreed. The first question to ask is whether or the dividend is covered, he suggested.
“If not, you are just paying income out of capital. Others use derivatives to boost their income, selling away some of the potential gain to boost income,” he said. “Again, I’m not a fan, as this blunts the potential total return of the investment.”
Dividend yields are a function of the income offered, as well as the share price. If a fund is trading on a steep discount to net asset value (NAV), the yield may be high as a result. Therefore, Winterflood makes a distinction between funds offering a high dividend and those that are simply out of favour, Halberstadt explained.
“To disentangle the effects of discounts to NAV, we looked at the highest dividend yield on NAV instead. If you exclude special situations (i.e. returns of capital driven by managed wind-downs), examples of relatively high income on an absolute basis are Henderson Far East Income, Chelverton UK Dividend, Aberforth Split Level Income and abrdn Equity Income, all with NAV yields ranging between 7% and 11%.”
To complicate matters further, some investment companies are “manufacturing” yield by funding a revenue shortfall out of capital, Scouller said. For instance, Montanaro UK Smaller Companies paid a 4.5p dividend for the year ended 31 March 2023, when its revenue earnings per share were 2.3p and the capital return was -21p per share. The dividend paid was only 0.51x covered by revenue earnings, he noted.
Ryan Lightfoot-Aminoff, investment trust research analyst at Kepler Partners, said some trusts use revenue reserves to pay dividends in leaner years, having replenished the coffers during better times.
Halberstadt added that financing dividends from revenue reserves enables “a smoothing of dividend volatility over multi-year periods and the potential generation of dividend growth even when portfolio income stagnates”.
Trusts can also use debt financing – or gearing – to magnify their yield on NAV, he continued. “This is relevant for instance for Chelverton UK Dividend and Aberforth Split Level Income, who each have debt levels exceeding 30% of NAV.”
Another factor to consider is whether a trust’s yield appears to be high because of special dividends that may not continue.
Meanwhile, James Carthew, head of investment companies at QuotedData, warned investors to look out for value traps, where yields are high because the share price is cheap and likely to fall further. The best way to avoid value traps is to steer clear of the highest decile of high-yield equities, he noted.
“I think this explains Henderson Far East Income, which produces a yield far higher than most competing Asian income trusts yet its long-term total returns are by far the worst in its peer group (an average of 4.7% per annum over the past 10 years compared to 6.6% for abrdn Asian Income – the next worse – and 10.3% for Invesco Asia – the best),” Carthew said.
“Similarly, abrdn Equity Income is the worst-performing trust in its peer group (2.4% per year over 10 years, compared to 4.0% for Lowland, the next worse). However, there is another factor at play here, both trusts have highish exposures to smaller companies, which have been lagging their larger peers.”
At the other end of the spectrum, Carthew believes Henderson High Income is a better choice.
“It has a trick up its sleeve when it comes to generating its attractive yield. It borrows money long term at fixed rates and invests that in higher-yielding bonds. That generates income that goes toward the dividend and allows David Smith, the fund’s manager, to avoid the value traps and buy lower-yielding stocks with better business models and faster dividend and earnings growth. Investors in Henderson High Income get the best of both worlds, therefore.”
In some cases, a high income can be indicative of a timely investment opportunity, Allen pointed out. “Trusts paying a high income out of received income might indicate an area out of favour with markets and a potential opportunity; some Asian income trusts fit this bracket, and potentially some of the UK trusts too.”
Valuations in Indian large-caps do not appear stretched and are justified by the nation’s structural growth.
The Indian elections are in full swing, with current prime minister Narendra Modi hoping he has done enough to stay in power for a third term.
With a process lasting more than six weeks and with more than 970 million registered voters, the country has been dubbed ‘the world’s largest democracy’. To put this into context, the entire population of Europe is 741 million.
Modi is widely expected to retain power, with recent estimates indicating his Bharatiya Janata Party (BJP) will win around 300-320 seats – with a few more going to its allies (543 Lower House seats are divided up, with a 272-seat majority needed).
Modi’s policies have transformed India in the past decade. They cover banking, manufacturing, inflation management and an increased focus on physical and digital infrastructure, all of which have boosted the long-term growth potential of the economy.
The numbers speak for themselves – at a time when growth has been challenging across the globe, GDP in India stood at 6.7% and 6.4% in 2022 and 2023 respectively, with estimates that it can grow at 6.7% consistently over the next decade.
This is aided by some significant tailwinds benefitting the economy. They include demographics (50% of the population will be comprised of Millennials and Gen Z’s by 2030) and a growing middle class (the percentage of high and upper middle-income households in India is expected to rise from 26% in 2021 to 45% in 2030). In short, the characteristics of India’s growth are very much structural rather than cyclical.
More changes to come
Dipojjal Saha, a macroeconomist and product specialist at Ashoka India Equity, cites the infrastructure story as a key element, with a compound annual growth rate (CAGR) on capital expenditure standing at circa 20% since Modi came to power.
Saha said: “90% of India’s railways are now electrified, compared with 30-40% previously. The number of airports has doubled, while the turnaround time at ports has improved rapidly. Previously, some 20 million rural homes had access to tap water, now almost all of them have access.”
The second area bearing fruit is manufacturing, with India having already made strides in both defence and technology. The ‘Make in India’ initiative has successfully reduced India’s reliance on imported goods. India’s government has cut corporate taxes for new manufacturing production and launched production-linked incentive schemes across multiple sectors.
Goldman Sachs India Equity portfolio manager Hiren Dasani said: “Progress has been made since Make in India was first introduced in areas like electronics given fast-growing domestic demand. Capex intensive industries, such as electric vehicles and semiconductors, may have to rely on global corporations as they develop due to a lack of raw materials domestically. Mobile phone supply chains have been shifting from China to Vietnam and India.”
But there are clearly far more societal strides to be made. For example, the minimum wage in India is lower than other Asian economies, while only one in five women are in the official workforce.
Lofty valuations are justified – and this is why
The trouble is that India’s success story is one of the worst kept secrets and this is reflected in valuations. Figures show the MSCI India price-to-earnings (P/E) premium over the MSCI Emerging Markets index is currently between 70% and 80%, whereas the average since 2007 has been closer to 40%.
But there is a strong argument to support those numbers. Not only has growth been justified, given the likes of urbanisation, attractive demographics and the rise of digitalisation, but the de-rating of China has shaken up the composition of the market.
Only a couple of years ago, India accounted for just 10% of the MSCI Emerging Markets index (with China accounting for 35%). India’s exposure has now almost doubled to 18%, while China has fallen to 25%, Saha pointed out.
When you compare India’s valuations versus its own history, it is a different story. “Valuations for the past 10 years in India have been 20.7x, it is currently around a P/E of 19.7x, so they are not stretched. It has also seen the highest earnings growth amongst its peers,” Saha argued.
This bring us back to the aforementioned structural – not cyclical – growth story. Alquity Indian Subcontinent manager Mike Sell said that while India’s P/E has re-rated over the past decade due to Modi’s reforms, valuations are not stretched.
“India has a high P/E because of strong earnings growth over a number of years. The earning per share stand at 17%, giving it a price/earnings-to-growth (PEG) ratio of 1.3x. On a PEG basis, India is cheaper than the likes of Korea, Japan, Mexico and the UK,” Sell said.
“Countries like Korea, Taiwan and Thailand may have a lower PEG, but they are cyclical, not structural stories. India has multi-years of growth, not pockets of opportunity.”
One area that does look more expensive is the small and mid-cap space. UTI India Dynamic Equity assistant manager Ravi Gupta said valuations are at a 25% premium for mid-caps and slightly higher for small. This follows two strong years when firstly, supply chains recovered as businesses started to re-open post-Covid, promptly followed by the fall in commodity prices.
Gupta’s exposure remains around the 35-40% mark in the small and mid-cap space, having taken profits in some areas and reoriented into other parts of this market. “One thing that has helped in the last few years has been the increase in IPOs. It has presented a number of opportunities to investors,” he added.
India’s growth is hard to ignore. The International Monetary Fund expects it to be the third-largest global economy by 2030 as its GDP continues to stand out from its peers. Valuations are a consideration – but experienced active managers should be able to cut through the noise to tap into the opportunities in the region.
The case for investing in India as a standalone allocation continues to grow. Those who may prefer exposure as part of a wider emerging markets portfolio may want to consider the likes of the GQG Partners Emerging Markets Equity or FSSA Global Emerging Markets Focus, which have 29.7% and 24% invested in the country, respectively.
The views expressed above should not be taken as financial advice. Darius McDermott is managing director of FundCalibre and Chelsea Financial Services.
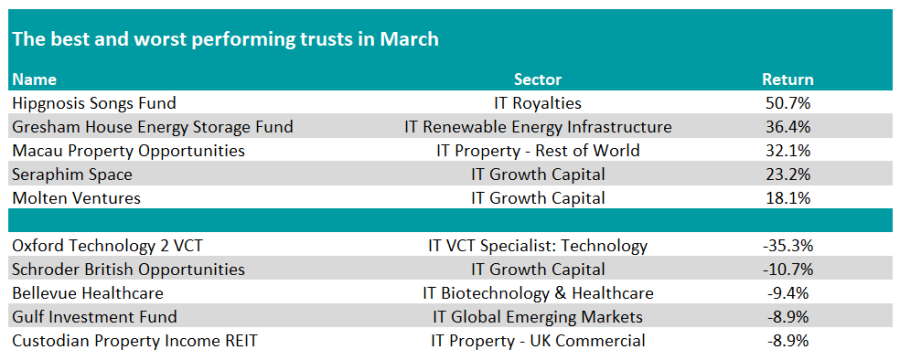
China and the UK strike back, while Hipgnosis Songs returns a record 50.7% in a single month.
Chinese equities recovered from their doldrums and soared to the top of the charts in April, but experts are wondering whether this is merely a “dead cat bounce”.
IA China/Greater China was the best performing sector in April, with the average fund gaining 5.9%.
It is the second time this year, following February, that the sector has claimed the top spot. However, the main reason for this outperformance appears to be the market's cheapness, with Chinese equities trading at nearly 20-year lows.
Ben Yearsley, director at Fairview Investing, posed the question: “Is this a dead cat bounce or are investors starting to see real value in China?”
India – China’s main rival in the emerging markets – also had a robust month. The IA India/Indian Subcontinent sector ranked as the third best performer in April, with the average fund returning 3.3%.
Although its two poster children outshone other markets, the IA Global Emerging Markets sector only returned 1.4% last month, making it the seventh best-performing sector.
Source: FE Analytics
The UK, another unloved and cheap market, also had a strong run in April, with the FTSE 100 hitting an all-time high. As a result, IA UK Smaller Companies, IA UK Equity Income and IA UK All Companies all feature among last month’s six best-performing sectors.
Yearsley said: “BHP’s bid for Anglo American plus other decent results and continued buybacks are propelling one of the most unloved markets higher. Interestingly, some fund managers don’t think the UK market has reacted yet to £50bn a year of share buybacks as it’s pension funds that have been selling to fund the purchases.
“Now they’ve almost run out of UK equities, where will companies get their shares from to repurchase? Will this finally ignite the market?”
At the foot of the table, IA Healthcare was April’s worst-performing sector, followed by IA North American Smaller Companies and IA Japan, which was impacted by the weak yen.
“The Bank of Japan disappointed markets with no further action to either support their currency or up rates. Consequently, the yen was again the weakest of the major currencies falling 3.03% against sterling,” Yearsley said.
Source: FE Analytics
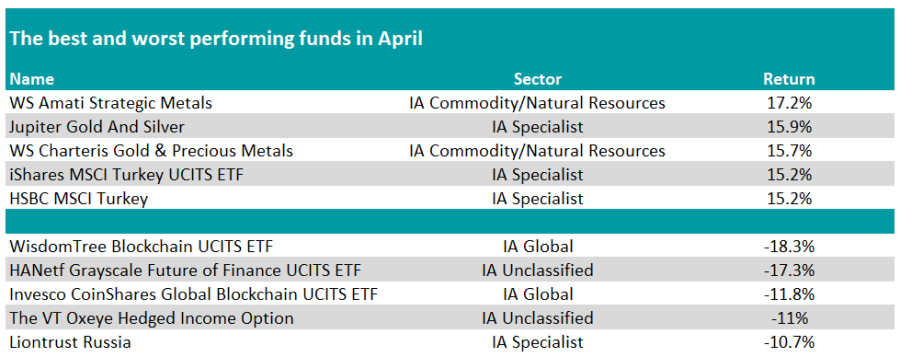
At the fund level, funds specialising in precious metals once again claimed the top spots, mirroring their performance from last month.
WS Amati Strategic Metals led the pack with the highest return at 17.2%. It was closely followed by Jupiter Gold And Silver and WS Charteris Gold & Precious Metals, the latter maintaining its position at the top of the table for a second consecutive month.
Yearsley said: “Gold hitting an all-time high has finally had an impact on gold equities as well as other related areas. Silver has been on a tear as well.
“Also, in the broader commodity space, copper is responding to a shortage in supply and an increase in demand due to decarbonisation and electrification. The price of copper rose about 15% in April.”
Passive funds tracking the MSCI Turkey index also had a strong month.
There was no discernible trend at the bottom of the table. WisdomTree Blockchain UCITS ETF was the worst-performing fund, as it fell 18.3%, while The VT Oxeye Hedged Income Option made its second appearance in a row among the laggards.
“It’s a fund that has featured regularly at both top and bottom of the tables,” Yearsley said.
Source: FE Analytics
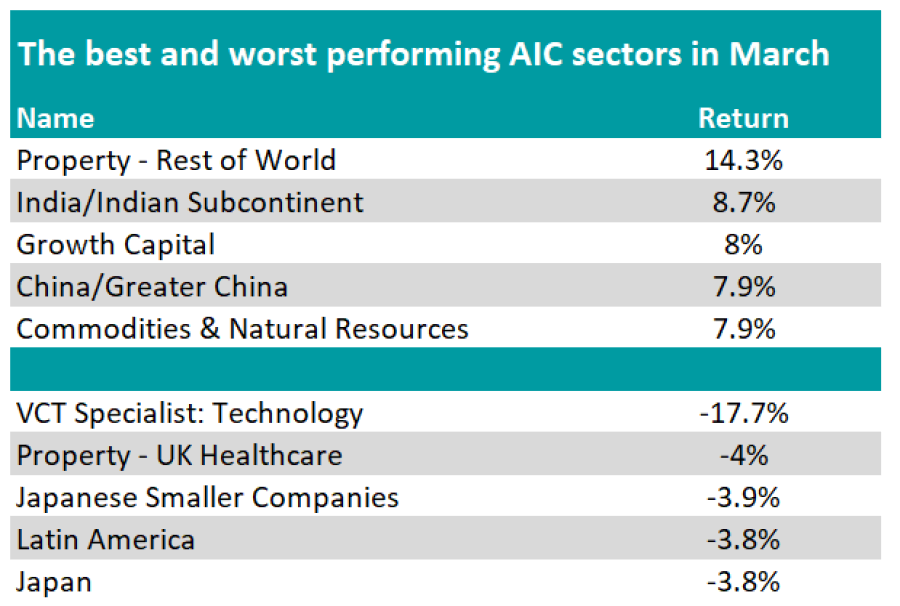
In the world of investment trusts, the IT Property – Rest of World sector claimed the top spot, followed by the IT India/Indian Subcontinent and IT Growth Capital sectors.
Meanwhile, at the bottom of the pile, we find IT VCT Specialist: Technology, IT Property – UK Healthcare, and IT Japanese Smaller Companies.
Looking at individual funds, Hipgnosis Songs Fund took the crown, after returning 50.7% in a single month. The music royalties trust has been at the centre of a bidding war, culminating in Blackstone agreeing on 29 April 2024 to acquire it for roughly $1.6bn.
Yearsley said: “Hipgnosis is finally being put out of its misery with bid and counterbid propelling it to the summit last month with a gain of 50%. Obviously, context is everything and it only means it’s a few pennies above the IPO price. Such is the ignominy it has had over the last year or so. The whole episode does leave an unpleasant taste for many.”
Source: FE Analytics
Other top performers in April include Gresham House Energy Storage Fund, Macau Property Opportunities, Seraphim Space and Molten Ventures.
Conversely, Oxford Technology 2 VCT, Schroder British Opportunities, Bellevue Healthcare, Gulf Investment Fund and Custodian Property Income REIT were the worst performing investment trusts.
Investors could emulate the Sage of Omaha by reinvesting dividends, holding stocks forever and only investing in areas they understand – or by buying Berkshire Hathaway shares.
Berkshire Hathaway’s Warren Buffett is one of the most successful investors of all time but the basic tenets of his approach are uncomplicated and can be adopted by private investors. What’s more, there are several ways to gain exposure to Berkshire Hathaway directly or to funds with similar approaches.
Since the start of Buffett’s career in 1965, Berkshire Hathaway has produced a staggering 4,384,749% return, turning $100 into more than $4.3m. An investor who put $100 into the S&P 500 index in 1965 instead would have made $31,323.
If this makes you want to invest in Berkshire Hathaway, chances are that you already do.
Berkshire Hathaway is the seventh biggest stock in the US, having overtaken Tesla this year, so anyone owning an S&P 500 tracker will have 1.8% in Berkshire Hathway, which falls to about 1% for passive global equity funds.
Investors who want to increase their exposure can buy ‘B’ class shares in Berkshire Hathaway, which is quoted on the New York Stock Exchange, for £330 each and these shares can be held in an ISA, SIPP or standard trading account.
However, Laith Khalaf, head of investment analysis at AJ Bell, pointed out that “Berkshire is a bit of a strange beast, part holding company, part investment portfolio, so it’s set apart from a normal investment trust or fund, though it is still a capital allocation vehicle for Warren Buffett”.
Therefore, some investors might prefer to opt for a fund with a similar investment philosophy to Buffett and there are plenty of choices.
“Lindsell Train also hunts for high-quality companies with competitive advantages and quotes Buffett in its investment philosophy,” Khalaf said.
“Fundsmith’s mantra of ‘buy good companies, don’t overpay and do nothing’ could easily have been penned by Buffett and the publication of an ‘owner’s manual’ was an idea pioneered by Buffett in the 1990s.”
Performance of funds versus sector over 10 years
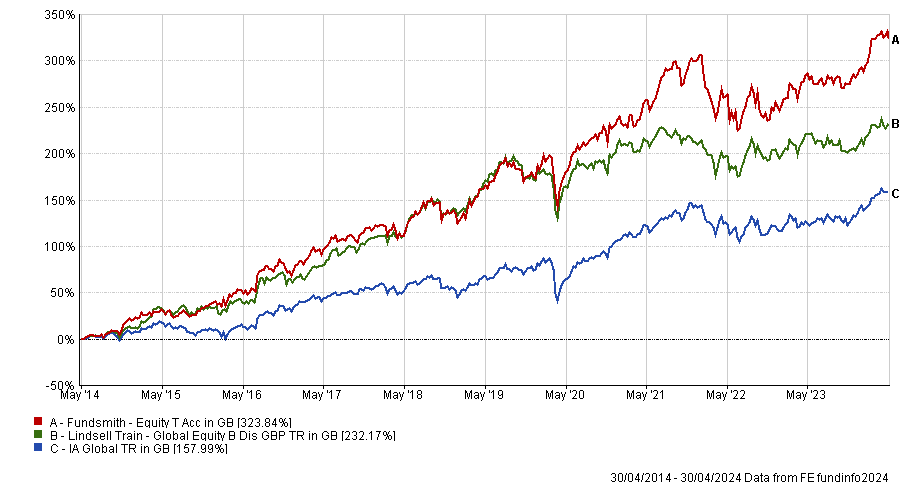
Source: FE Analytics
Khalaf continued: “Meanwhile, a lesser known fund, SDL UK Buffettology, explicitly seeks to replicate Buffett’s investment style within the confines of the UK stock market.
“Buffett’s pawprints can be found liberally spattered across the investment management industry in one form or another.”
Performance of fund versus sector over 10 years
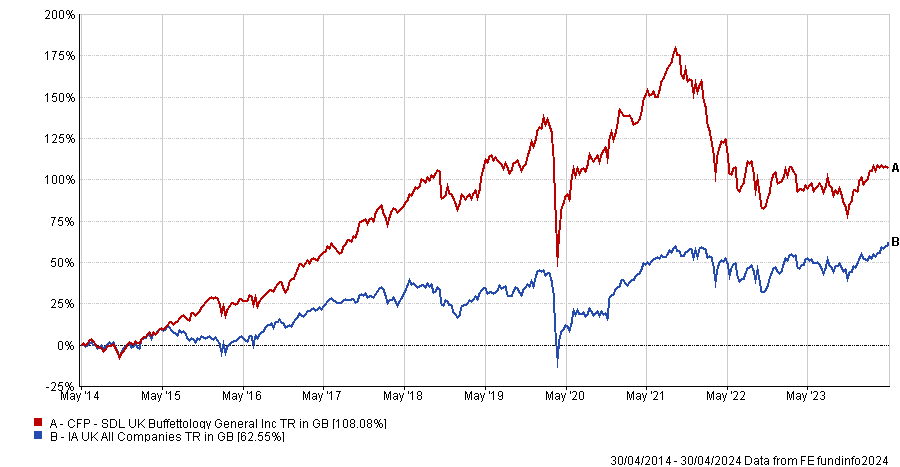
Source: FE Analytics
Investors could go one step further and adopt Buffett’s principles themselves.
First and foremost, Buffett is an advocate of long-term, buy-and-hold investing. “Our favourite holding period is forever,” is one of his most-quoted sayings.
Khalaf added a word of caution: “Investors should also be wary of letting a long-term view slip into complacency or apathy, which can be harmful if poorly performing stocks or funds in your portfolio aren’t occasionally weeded out.”
Despite being one of the world’s best-known active managers, Buffett is an advocate of cheap passive funds. In his will, he has requested that 90% of the money he leaves to his wife be invested in a low cost S&P 500 tracker and the other 10% be held in short-term government bonds.
For investors who do want to take a punt on active managers, the Buffett way is to opt for high-conviction strategies. As Khalaf explained: “The point is, if you are going to invest in active funds, you should do it properly by choosing a manager who acts with conviction and puts meaningful sums into each of the companies they back, rather than placing a chip in most of the companies on the stock market.”
For investors who do not need to draw an income from their portfolio, dividends should be reinvested. “Buffett likes to receive dividends, even though Berkshire Hathaway doesn’t pay one,” Khalaf said. Instead, Buffett recycles dividend income into new investment opportunities.
“The long-term benefits of rolling up dividends are clear, particularly when investing in a high yield market like the UK, and especially if maintained within the tax sheltering walls of an ISA,” he added.
Finally, never invest in something you do not understand and that applies especially to cryptocurrency. Buffett went so far as to say that cryptocurrencies are “probably rat poison squared” and “they will come to a bad ending”.
The House of Lords has written to the Financial Conduct Authority demanding urgent action to resolve the 'ludicrous' cost disclosure rules for investment trusts.
The House of Lords has lambasted the Financial Conduct Authority (FCA) for misinterpreting European Union regulations on cost disclosure requirements for investment trusts.
Misleading costs are discouraging investors from putting as much as £7bn a year into investment trusts – money that some of the more domestically-focussed trusts could channel into the UK economy.
This has resulted in a material loss of permanent investment into the capital markets via equity trusts and the acquisition of UK real assets by foreign investors at significantly reduced prices, the House of Lords financial services regulation committee wrote in a letter to FCA chief executive Nikhil Rathi, published today.
The letter criticised the FCA’s interpretation of MiFID (Markets in Financial Instruments Directive) and PRIIPs (Packaged Retail Investment and Insurance-based Products). These regulations are compelling investment trusts to report their costs in the same format as open-ended funds.
For investors in open-ended funds, managers’ fees eat into the returns they receive. That is not the case for listed investment companies, where costs do not detract from the share price gain or loss that investors experience. Disclosing costs for trusts in the same way as funds risks confusing investors and makes trusts appear more expensive than they actually are.
“This has created a falsely elevated number for aggregated ongoing cost forecasts,” the committee’s letter stated, “giving misleading information to investors and indicating that costs/expenses are to be deducted annually from shareholdings.”
Baroness Bowles of Berkhamsted, a member of the House of Lords financial services regulation committee, said investment trusts “have given institutions and individuals an opportunity to invest in infrastructure, growth companies and renewable energy” an are “a British success story”.
“This success is under threat by the FCA’s interpretation of EU-retained MiFID and PRIIPs, which is not shared by any other country, and has created an unlevel playing field on an international level. Urgent steps are necessary to resolve the problems that have been created.”
The FCA’s forbearance statement, issued on 30 November 2023, granted investment companies some reprieve by enabling them to provide a factual breakdown of the component parts of their costs, with additional context. This “helped, but does not go far enough”, Bowles said.
Part of the problem involves a central EU database in which costs are recorded. “A potential solution could lie in requiring Authorised Corporate Directors to enter zero into the appropriate column that is for ongoing fund charges, aligning with the practices of EU funds, rather than inputting figures that result in misleading disclosures,” she suggested.
“It is ludicrous that directors and companies are being forced to make misleading statements to investors.”
Trustnet looks at funds within the IA Global sector that have been run by the same manager since 2004 or earlier and have achieved top-quartile returns over the past three years.
The IA Global sector is arguably the most competitive in the Investment Association universe, with 566 funds attempting to make outsized returns.
One way investors could look to whittle down the array of options is to look at veteran fund managers who have delivered time and again – after all, there has been no shortage of hurdles in the world of global equities over the past few decades.
Below, Trustnet researched the funds that have been managed by the same person since 2004 or earlier and have produced top-quartile returns over the past three years, showing those who have been through it all and continue to make top returns.
One of those funds is GS Goldman Sachs Global CORE® Equity Portfolio, managed by Len Ioffe since October 2004. In January 2013, he was joined by Osman Ali and Takashi Suwabe.
Their portfolio aims to replicate the same style, sector, risk and capitalisation characteristics as the fund’s benchmark (the MSCI World index), with the underlying stock and country selection responsible for generating outperformance.
Due to the benchmark-aware approach, the fund has a low tracking error. However, it is not a full replication of the MSCI World index. For example, it is underweight Tesla relative to the benchmark and does not hold Exxon Mobil, both of which are top 10 constituents of the MSCI World index.
Furthermore, it has overweight positions in European stocks such as ASML and Novo Nordisk, with both featuring among the fund’s top 10 holdings.
Although it sits in the top quartile of the IA Global sector over three years, it has slightly lagged the MSCI World index. This underperformance can be attributed to recent market returns being driven by a handful of names. Moreover, the fund has been more volatile than the benchmark as well as its sector peers in this timeframe.
Performance of fund over 3yrs (to last month end) vs sector and benchmark
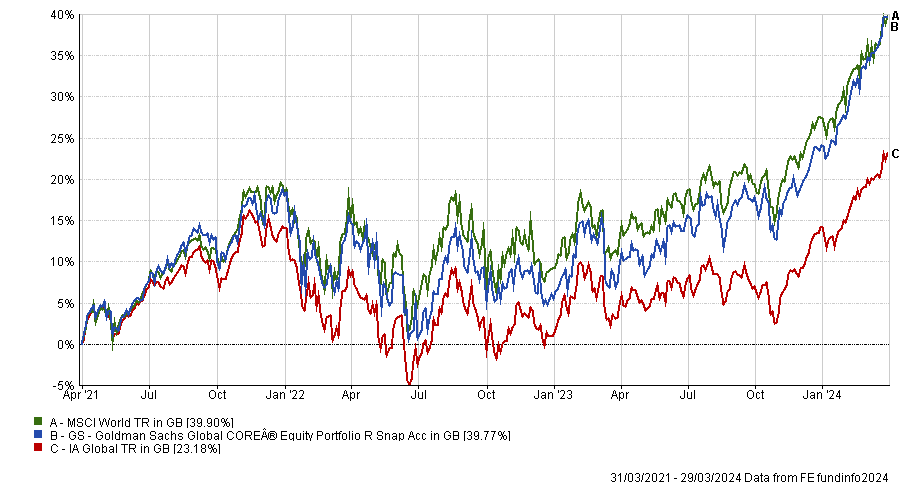
Source: FE Analytics
The higher volatility relative to the benchmark and the sector has also been a feature of the fund over the past decade. However, it has delivered returns in excess of the MSCI World index in that period, while also ranking among the sector’s top quartile funds.
The other veteran manager to achieve the same feat is Mike Willans, who has been at the helm of WS Canlife Global Equity since 2004 and was joined by Bima Patel in 2018.
They build their portfolio by combining both top-down macro views and bottom-up stock picking. The managers also try to spread their allocation across different sectors and factors to ensure balance and diversification.
Moreover, Willans and Patel may invest in bonds and other collective investment schemes to diversify their sources of return. For instance, the fund currently invests in US utilities tracker iShares S&P 500 Utilities and X Harvest CSI 300, which replicates the performance of the 300 largest companies listed on the Shanghai and Shenzhen stock exchanges.
When it comes to stock selection, the two managers consider factors such as a company’ market position, the strength of its brand, its susceptibility to current market and economic trends and the drivers behind its earnings and dividend growth.
Performance of fund over 3yrs (to last month end) vs sector and benchmark
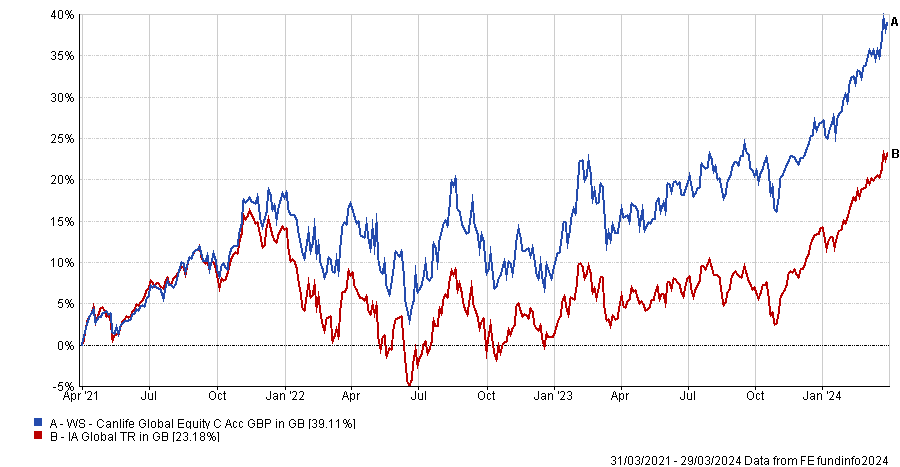
Source: FE Analytics
Its five largest holdings include Microsoft, Apple, Amazon, Alphabet and JP Morgan Chase & Co, according to FE Analytics.
The fund has also made a top-quartile performance over five years, but sits in the second quartile of the IA Global sector over a decade. Nonetheless, it has consistently been one of the least volatile funds in the sector, both over three and 10 years.
The information contained within this website is provided by Web Financial Group, a parent company of Digital Look Ltd. unless otherwise stated. The information is not intended to be advice or a recommendation to buy, sell or hold any of the shares, companies or investment vehicles mentioned, nor is it information meant to be a research recommendation.
This is a solution powered by Digital Look Ltd incorporating their prices, data, news, charts, fundamentals and investor tools on this site. Terms & Conditions. Prices and trades are provided by Web Financial Group and are delayed by at least 15 minutes.
© 2024 Refinitiv, an LSEG business. All rights reserved.
 Please wait...
Barclays Investment Solutions Limited provides wealth and investment products and services (including the Smart Investor investment services) and is authorised and regulated by the Financial Conduct Authority and is a member of the London Stock Exchange and NEX. Registered in England. Registered No. 2752982. Registered Office: 1 Churchill Place, London E14 5HP.
Barclays Bank UK PLC provides banking services to its customers and is authorised by the Prudential Regulation Authority and regulated by the Financial Conduct Authority and the Prudential Regulation Authority (Financial Services Register No. 759676). Registered in England. Registered No. 9740322. Registered Office: 1 Churchill Place, London E14 5HP.